 Mind
Psychology · Core
Why We Sell Winners Too Soon and Hold Losers Too Long
Almost everyone has felt this pull. Here's why it happens, and a simple exit plan that makes it easier to follow through.
· 7 min read
Educational only, not financial advice. See the full Disclaimer.
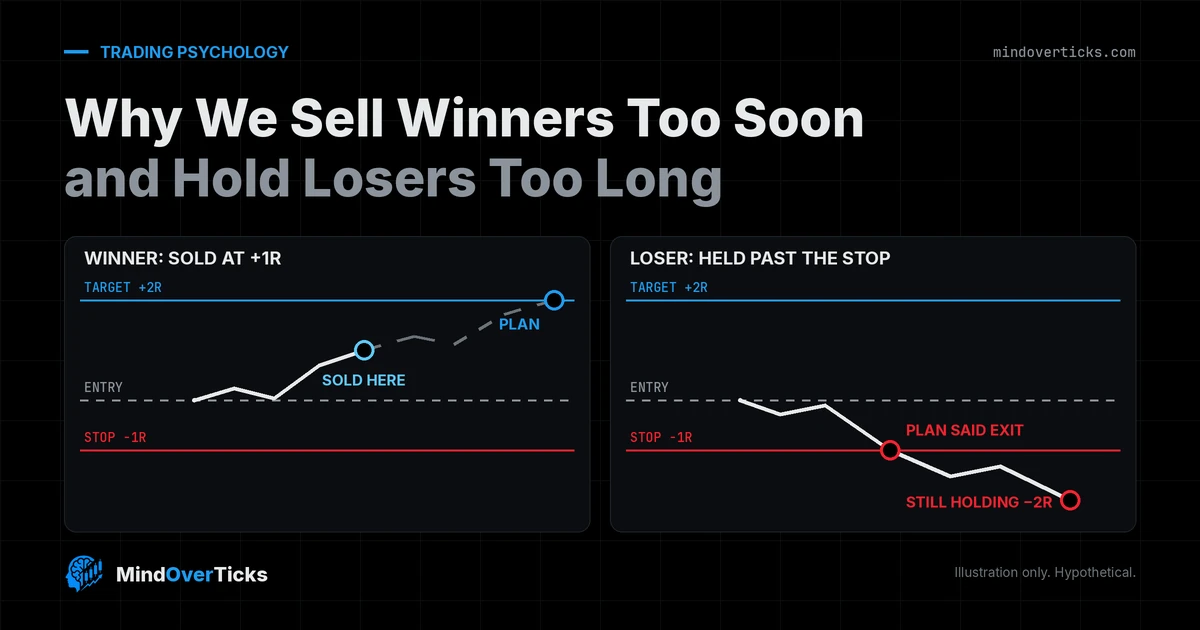
You take a quick profit on a trade that's working, then watch it keep climbing. Meanwhile, a losing trade sits in the account because selling would make the loss feel real. If that sounds familiar, you're in large company: researchers call it the disposition effect, and it shows up clearly in real brokerage records.
This post covers what the research found, why the habit costs more than it feels like it does, and a five-step routine for writing your exits down before you enter.
A few words first
- Disposition effect: the tendency to sell winning positions too soon and hold losing positions too long. Economists Hersh Shefrin and Meir Statman gave it the name in 1985.
- Paper gain or loss: a gain or loss on a position you still hold. It becomes realized when you sell.
- R: the amount you plan to risk on one trade. If you risk $100, then 1R = $100, a $200 gain is +2R, and a $200 loss is −2R. Our 1% Rule post shows how to pick that number.
- Stop order: an order that becomes a market order once a set price trades. More on its limits below.
What the research found
Finance professor Terrance Odean studied trading records from 10,000 accounts at a large US discount broker, 1987 through 1993. On days when investors sold something, they cashed in about 14.8% of the gains available to them but only about 9.8% of the losses. Put simply, a stock that was up was more than 50% more likely to be sold on a given day than a stock that was down.
That choice didn't pay off for this group. Over the following year, the winners they sold beat the losers they kept by about 3.4 percentage points, measured against the market. The one big exception was December, when investors sold more losers, most likely for tax reasons.
A lab study by Martin Weber and Colin Camerer (1998) found the same pattern: 59% of the shares people sold were winners and 36% were losers. One detail matters for us. When shares were sold automatically after each round, the effect was greatly reduced. Taking the decision out of the moment helped.
Why it feels right in the moment
Daniel Kahneman explains the pull with mental accounts. We tend to treat each position as its own little scorecard. Selling a winner closes that card as a win. Selling a loser closes it as a loss, and nobody enjoys signing that.
Odean's paper connects the habit to prospect theory (Kahneman and Tversky, 1979). In plain terms, people judge outcomes against the price they paid. Above it, they tend to play safe and lock in the gain. Below it, they tend to take more risk in the hope of getting back to even.
None of this means something is wrong with you. It's a very human way of keeping score. It just isn't how your account keeps score.
Why the habit costs more than it feels like
Here's a hypothetical. Take 10 trades with 5 winners and 5 losers. Now run them two ways.
- Written plan: winners reach a +2R target and losers exit at −1R. Result: 5 × 2R − 5 × 1R = +5R.
- Gut exits: winners get sold at +1R and losers are held to −2R. Result: 5 × 1R − 5 × 2R = −5R.
Same trades, same 50% win rate, opposite results.
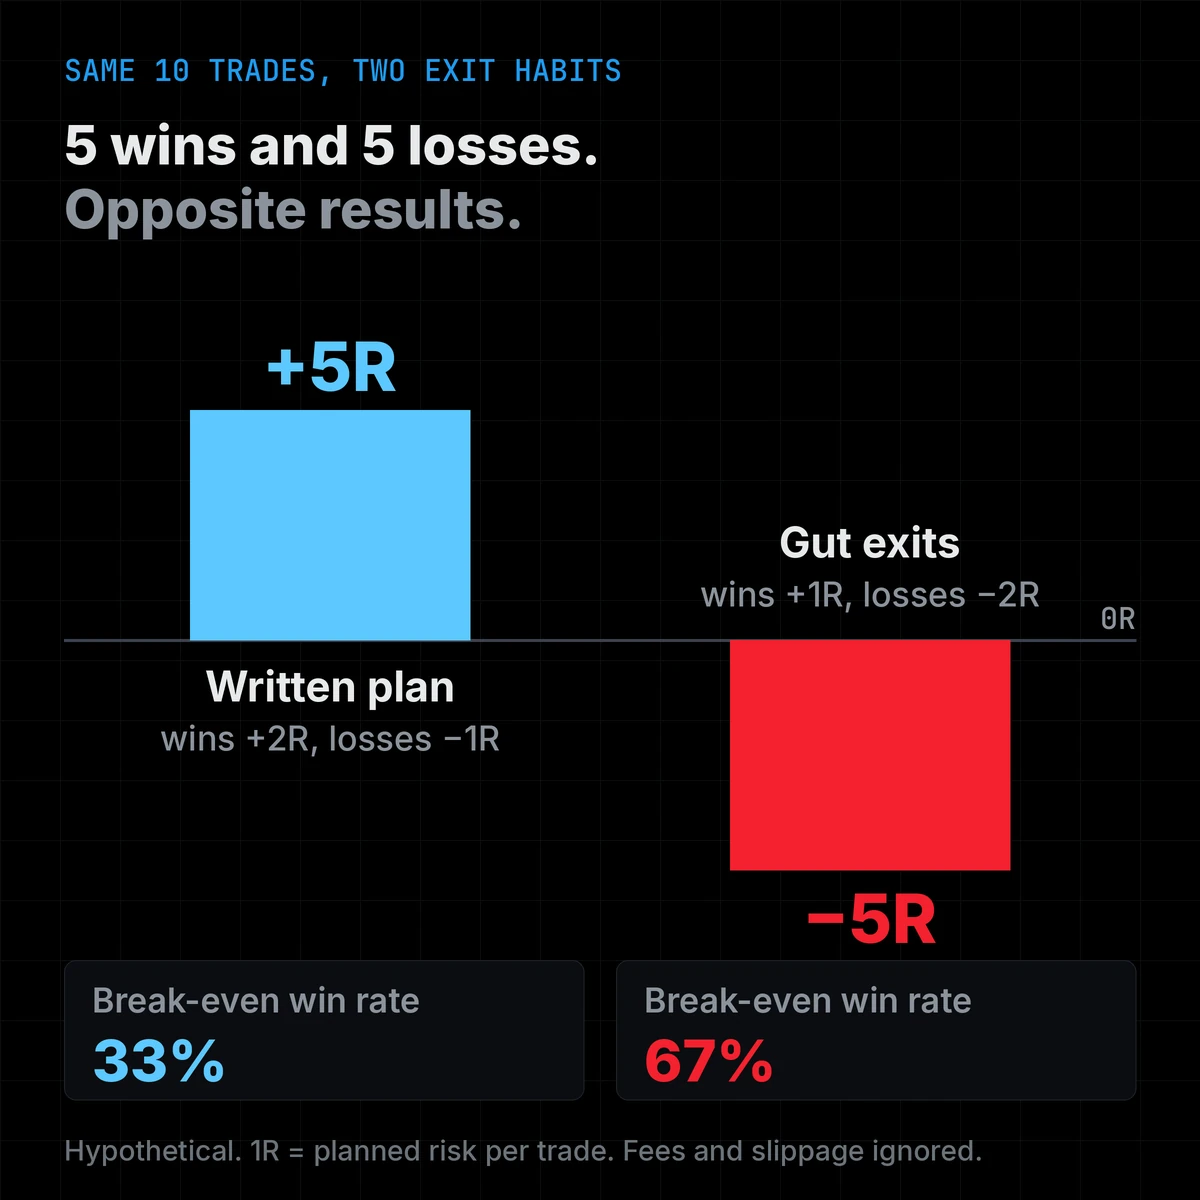
A quick way to see it is the break-even win rate: average loss ÷ (average win + average loss). With +2R wins and −1R losses, that's 1 ÷ 3, about 33%. With +1R wins and −2R losses, it's 2 ÷ 3, about 67%. The gut-exit habit quietly asks you to be right two times out of three just to stay flat. (Fees and slippage would push both numbers a little higher.)
How to do it: a five-step exit plan
The research points to the same idea twice: decide early, then let the decision carry you. Here's a routine you can use on your next trade. We'll walk it through a hypothetical example: a $10,000 account risking 1% ($100) on a stock bought at $40.
- Write the stop first. Put it where your trade idea is clearly wrong, for example just beyond a zone from our support and resistance guide. Here, $38. That's $2 of risk per share, so shares = $100 ÷ $2 = 50.
- Write the target or exit rule. Here, $44: that's $4 × 50 = $200, or +2R. If you prefer to trail a stop instead of using a fixed target, write that rule down now.
- Turn both into if-then sentences. "If $38 trades, then I'm out, with no new reasons." "If $44 trades, then I sell." A large review of if-then planning, covering 94 tests and more than 8,000 people (Gollwitzer and Sheeran, 2006), found a medium-to-large boost in following through on goals. That research wasn't about trading, but the tool is the same.
- Place the stop as a real order when you enter. This is your version of the automatic sale in the Weber and Camerer study: the decision is already made. Know its limit, too. Per Investor.gov, a stop becomes a market order when triggered, so in a fast market your fill can be worse than $38.
- Use a one-way rule, then log it. Your stop may move toward profit, never away from it. After each exit, write one line in your trading journal: "Followed the plan: yes or no." A few weeks of those lines shows you your own pattern.
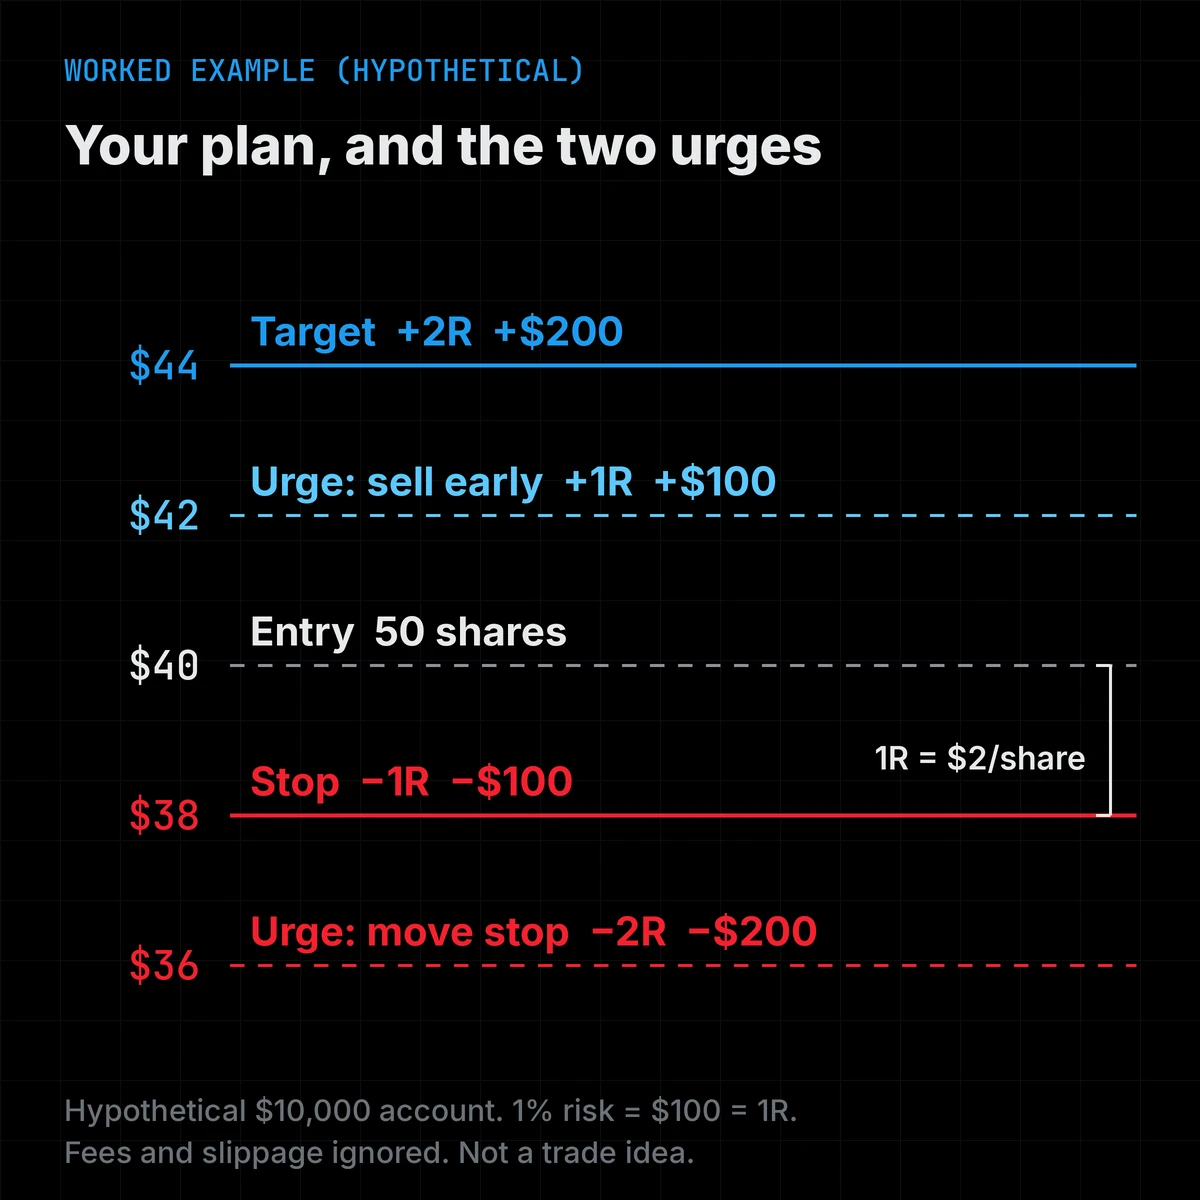
Now picture the two urges from the chart. Selling at $42 because "a profit is a profit" books $2 × 50 = $100, which is +1R instead of the planned +2R. Sliding the stop down to $36 to "give it room" turns a planned $100 loss into $4 × 50 = $200, which is −2R and 2% of the account instead of 1%.
Here's a plan card you can copy into your notes:
TRADE PLAN (before entry)
Entry: ____   Stop: ____
Risk per share: ____
Shares = risk ÷ risk/share: ____
Target or exit rule: ____ (= __R)
If ____ trades, I exit.
  No new reasons.
If ____ trades, I ____.
Stop moves only toward profit.
After exit: plan followed? Y / N
Limits worth knowing
- A 2R target isn't magic. Some approaches take small profits on purpose and win often enough to make it work. The point is that the exit is chosen before entry and fits the math, not that one ratio is right.
- A stop is a plan, not a floor. Gaps and fast markets can fill you past your stop, so a −1R plan can become a bigger loss.
- Know what the studies cover. Odean looked at US individual stock investors from 1987 to 1993, and the 3.4-point gap is that group's average, not a forecast for your trades. Weber and Camerer ran a lab experiment. The if-then research comes from general goal studies.
- Not every early exit is the bias. Leaving early because of a rule you wrote in advance, such as "out before earnings," is following your plan.
- Taxes are personal. December tax selling showed up in the data, but your situation is your own. This post isn't tax advice.
The mind side
If you've sold a winner too early or held a loser too long, you've done what most people do. The fix is less about willpower in the moment and more about making the decision while you're calm, before money is on the line.
When you feel the pull to change a plan mid-trade, try one question: "If I had no position right now, would I buy here, with this stop?" It moves your attention from what you paid to what's in front of you.
The short version
- Most of us find it easier to sell a winner than a loser. Brokerage records and lab studies both show it.
- With 5 wins and 5 losses, +2R/−1R exits net +5R while +1R/−2R exits net −5R.
- Write the stop, target and if-then sentences before you enter, and place the stop as an order.
- Let the stop move only toward profit, and log "followed the plan: yes or no" after every exit.
Sources
- Odean, T. (1998). Are investors reluctant to realize their losses? The Journal of Finance, 53(5), 1775–1798. doi.org/10.1111/0022-1082.00072 (author copy: berkeley.edu)
- Shefrin, H., & Statman, M. (1985). The disposition to sell winners too early and ride losers too long: Theory and evidence. The Journal of Finance, 40(3), 777–790. doi.org/10.1111/j.1540-6261.1985.tb05002.x
- Weber, M., & Camerer, C. F. (1998). The disposition effect in securities trading: An experimental analysis. Journal of Economic Behavior & Organization, 33(2), 167–184. doi.org/10.1016/S0167-2681(97)00089-9
- Kahneman, D., & Tversky, A. (1979). Prospect theory: An analysis of decision under risk. Econometrica, 47(2), 263–291. doi.org/10.2307/1914185
- Gollwitzer, P. M., & Sheeran, P. (2006). Implementation intentions and goal achievement: A meta-analysis of effects and processes. Advances in Experimental Social Psychology, 38, 69–119. doi.org/10.1016/S0065-2601(06)38002-1
- Kahneman, D. (2011). Thinking, Fast and Slow, Chapter 32, "Keeping Score." Farrar, Straus and Giroux.
- U.S. Securities and Exchange Commission, Investor.gov. Stop order (glossary).
Examples are hypothetical and for illustration only. Study findings are from the cited papers (US brokerage accounts 1987–1993; a laboratory experiment; general goal research). Educational only, not financial advice. See the full Disclaimer.
Up next: How to Keep a Trading Journal You'll Actually Use · Share on X · Follow @MOT_HQ