 Mind
The 1% Rule: How Small Risk Keeps You in the Game Through a Losing Streak
Educational only, not financial advice (disclaimer).
Sooner or later, most of us hit a losing streak. Not one bad trade, but several in a row, the kind that makes us doubt everything. A losing streak is not necessarily a sign that something is broken. Even a sound approach will string losses together from time to time, simply because outcomes come in clumps.
So the real question is not “how do we avoid losing streaks?” It is “how do we make sure a losing streak does not end our trading?” The 1% rule is one of the simplest answers we know.
What the 1% rule means
The 1% rule says: on any single trade, we risk no more than 1% of our current account.
“Risk” here means the money we lose if our stop is hit, not the size of the position. If you have not read it yet, our companion post, position sizing in plain numbers, shows how to turn that 1% into an exact share count. For now, all we need is the idea: each loss takes a small, fixed slice of whatever the account is worth at that moment.
There is nothing magic about the number 1. Some traders use less, some use a bit more. What matters is that the slice is small and fixed in advance. To see why, we need a little math.
The math of a losing streak (hypothetical numbers)
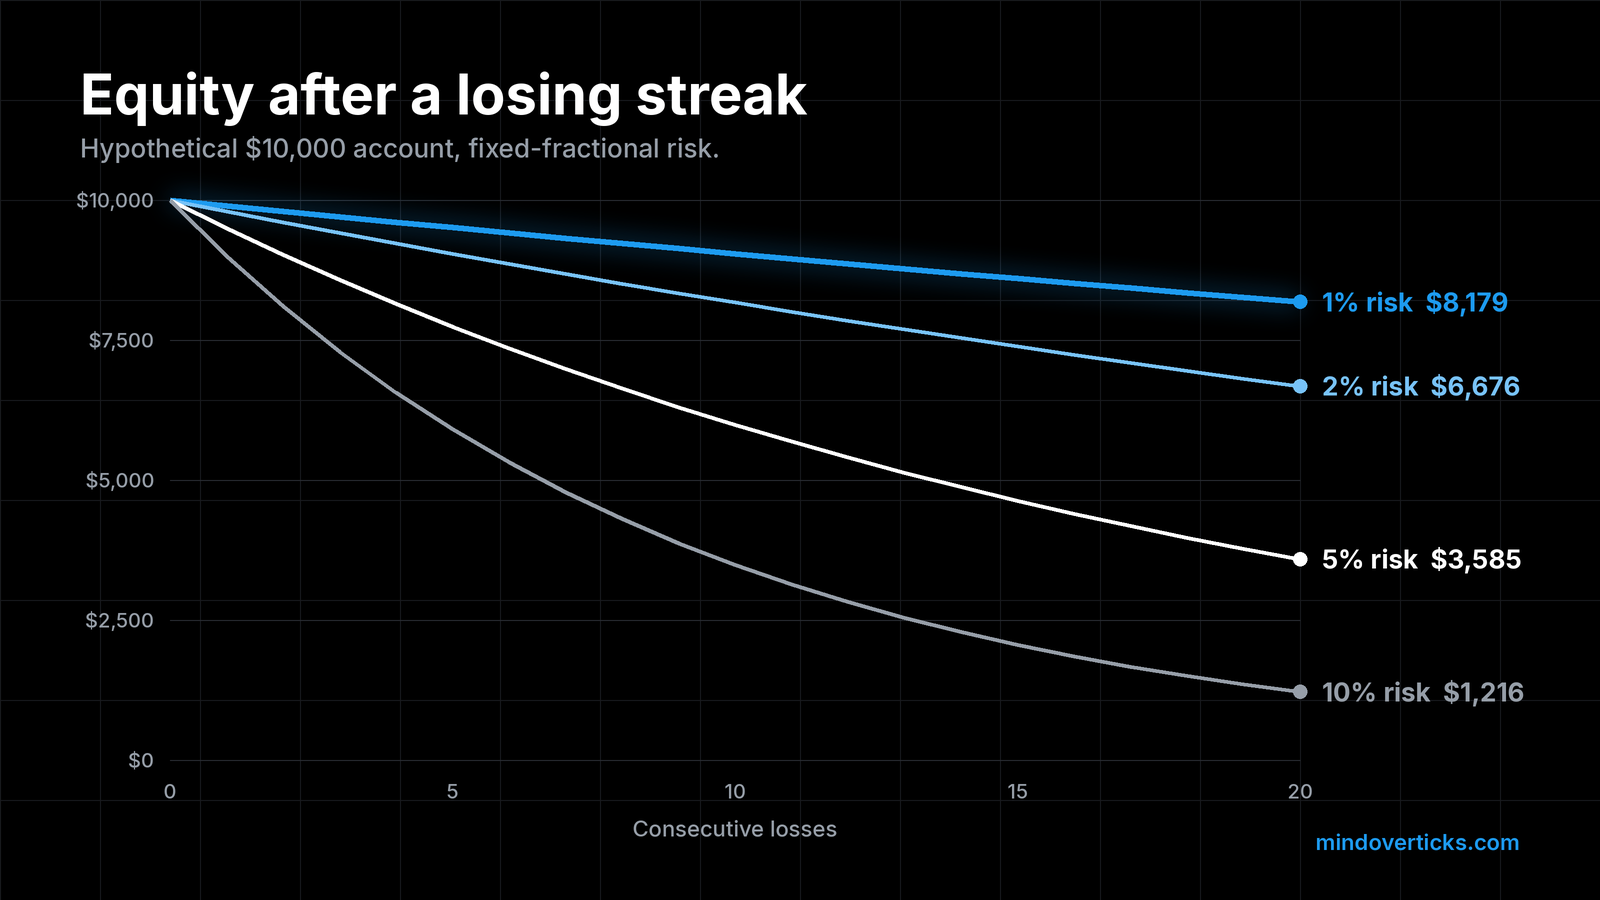
When we risk a fixed fraction of the current account, each loss shrinks the account by that fraction. After one loss at risk r, we have (1 minus r) of what we started with. After two losses, (1 minus r) times (1 minus r). After n losses in a row:
Equity left = (1 minus r) to the power of n
That is all. We computed every number below with a short script, so anyone can rerun the math. The account is a hypothetical $10,000, and these are not real trades or results.
| Risk per trade | After 5 losses | After 10 losses | After 20 losses |
|---|---|---|---|
| 1% | $9,510 (down 4.9%) | $9,044 (down 9.6%) | $8,179 (down 18.2%) |
| 2% | $9,039 (down 9.6%) | $8,171 (down 18.3%) | $6,676 (down 33.2%) |
| 5% | $7,738 (down 22.6%) | $5,987 (down 40.1%) | $3,585 (down 64.2%) |
| 10% | $5,905 (down 41.0%) | $3,487 (down 65.1%) | $1,216 (down 87.8%) |
Read the table slowly. At 1% risk, even 20 straight losses leave about 82% of the account in place. That would be a miserable stretch, but we would still be trading. At 10% risk, just 10 straight losses leave about a third of the account, and 20 leave around 12%.
One more detail worth noticing: because each loss is a percentage of a shrinking account, the dollar losses get smaller as we go. That is a quiet benefit of fixed-fractional risk. It brakes automatically when things go badly.
Why losses are harder to undo than they look
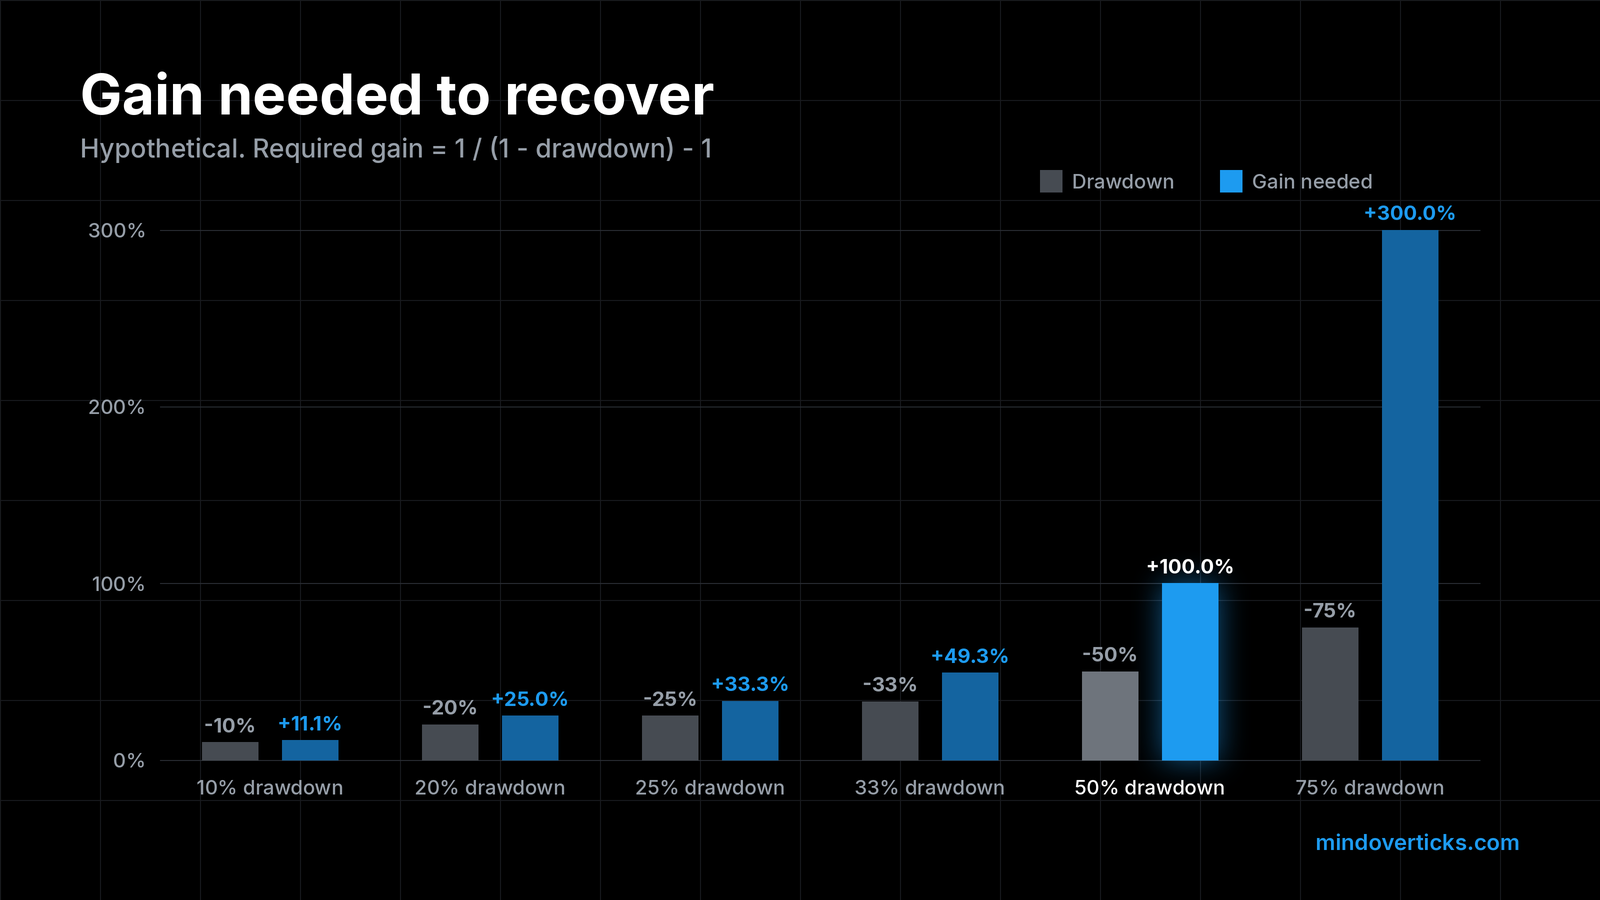
Here is the part that catches most of us off guard. A 50% loss does not need a 50% gain to fix. It needs a 100% gain. The formula is:
Gain needed to recover = 1 / (1 minus drawdown), minus 1
From the same script:
| Drawdown | Gain needed to get back to even |
|---|---|
| 10% | 11.1% |
| 20% | 25.0% |
| 25% | 33.3% |
| 33% | 49.3% |
| 50% | 100.0% |
| 75% | 300.0% |
Small drawdowns need only a little more than their size to recover. Large drawdowns need far more. The curve bends upward fast.
Now put the two tables together, using the same hypothetical streaks:
- 20 losses at 1% risk: down 18.2%, needs about 22.3% to recover.
- 20 losses at 5% risk: down 64.2%, needs about 179% to recover.
- 20 losses at 10% risk: down 87.8%, needs about 722% to recover.
The first is a hard climb. The last is, for most practical purposes, the end of that account.
Why “it won’t happen to me” is the risky thought
It is tempting to look at 10 or 20 losses in a row and think, “that would never happen.” We would gently push back. How likely a streak is depends on the win rate, the number of trades and plenty of things we cannot know in advance. We are not going to quote odds here, because they depend entirely on your own numbers. What we can say is that over hundreds of trades, long streaks become much more plausible than they feel on any given day.
Small risk is how we plan for the streak we did not see coming. A trading journal helps here too: our upcoming guide to keeping a trading journal shows how to track your own streaks honestly instead of guessing.
The emotional side of small risk
There is another benefit that does not show up in a table. When each loss costs 1%, a loss is annoying, not frightening. We can follow our plan, take the next valid setup and keep a clear head.
When each loss costs 5% or 10%, the stakes of every trade feel huge. That pressure is exactly when we start moving stops, skipping setups or trying to “win it back” with an oversized trade. Large risk does not only damage the account. It damages the decisions that come after.
Putting the 1% rule to work
A few practical habits:
- Use the current balance. Recalculate 1% from today’s account value, not the high point. That is what makes the risk shrink in a drawdown.
- Size from the stop. Place the stop where the chart says (see where to put a stop), then size so that hitting it costs 1%.
- Count costs. Slippage and fees can push a planned 1% loss a little higher. Leave a small buffer.
- Watch correlated trades. Three positions that all move together can act like one trade at 3% risk.
- Write it down. Put your risk rule at the top of your trading plan, so the decision is made before the market opens.
None of this guarantees profits. Nothing does. The 1% rule does something more modest and more important: it gives us time, enough trades to learn, adjust and let any real edge show up.
Takeaway
- The 1% rule: risk no more than 1% of the current account on any single trade.
- After n straight losses at risk r, equity left = (1 minus r) to the power of n.
- In our hypothetical table, 20 losses at 1% leave about 82% of the account. At 10%, about 12%.
- Recovery is lopsided: a 50% drawdown needs a 100% gain to get back to even.
- Small risk keeps losses survivable and keeps our decisions calm.
All figures are hypothetical and for education only. This is not financial advice and not a claim about any strategy’s performance.
Drafted with AI assistance, then fact-checked and edited by the Mind Over Ticks team.
Up next · 6 minWhat a Candlestick Actually Tells You