 Mind
How to keep a trading journal you'll actually use
The best journal is the one short enough that we still fill it in on a bad day.
Educational only, not financial advice (disclaimer).
Most of us start a trading journal with real enthusiasm. A fresh spreadsheet, twenty columns, color coding. By the second week it is half empty, and by the fourth we have stopped opening it, usually right after a rough day when it would have helped most.
The fix is rarely more discipline. It is a smaller journal. Here is a step-by-step way to build one we will keep using, plus a template to copy.
Why bother writing trades down at all
Memory is a generous editor. It keeps the clever trades and blurs the sloppy ones. A written record does not.
There is also research suggesting our trading habits deserve a closer look. Brad Barber and Terrance Odean studied brokerage accounts and wrote: “Of 66,465 households with accounts at a large discount broker during 1991 to 1996, those that trade most earn an annual return of 11.4 percent, while the market returns 17.9 percent” (Barber and Odean, 2000).
In an earlier study, Odean analyzed “trading records for 10,000 accounts at a large discount brokerage house” to test “the disposition effect, the tendency of investors to hold losing investments too long and sell winning investments too soon.” He found that “These investors demonstrate a strong preference for realizing winners rather than losers” (Odean, 1998).
Notice how those researchers found the pattern: by reading trade records. A journal is our way of running a small version of that check on ourselves. To be clear, this is our method. We do not know of a study showing that journaling by itself improves results.
A journal cannot tell us whether those findings apply to us. It can show how often we trade, why, and what it costs, in our own numbers.
Step 1: Decide what the journal is for
Pick one or two questions we want answered in the next month. For example:
- Do our planned trades do better than our impulse trades?
- Are we moving stops after entry?
A journal with a clear question stays short, because every field has to earn its place.
Step 2: Keep the fields to the minimum
Here is a starter set. Everything else is optional.
- Date and time of entry and exit.
- Ticker and direction (long or short).
- Setup: one short phrase for why we took it.
- Planned entry, stop and target, written before the trade.
- Actual entry and exit prices.
- Size in shares or contracts.
- Result in dollars and in R. “R” is simply the result divided by the amount we planned to risk. For example, a hypothetical trade that risked $100 and made $200 is +2R.
- Followed plan? Yes or no.
- One sentence on how we felt.
The planned stop matters most. If we choose it from the chart, as in where to put a stop, the journal can later show whether our stops are sitting in sensible places.
Step 3: Fill in the “before” half before clicking buy
The fields for setup, planned entry, stop and target go in first. This takes under a minute and does two jobs. It forces a plan to exist, and it gives us an honest baseline to compare against later, before the result can reshape our memory of it.
Step 4: Fill in the “after” half the same day
Right after the exit, or at the end of the session at the latest, add the actual prices, the result, the yes or no on following the plan, and one sentence on how it felt. Keep the feelings line short and specific: “Rushed in after a big green candle” is more useful later than “felt bad.”
Step 5: Review once a week, not after every trade
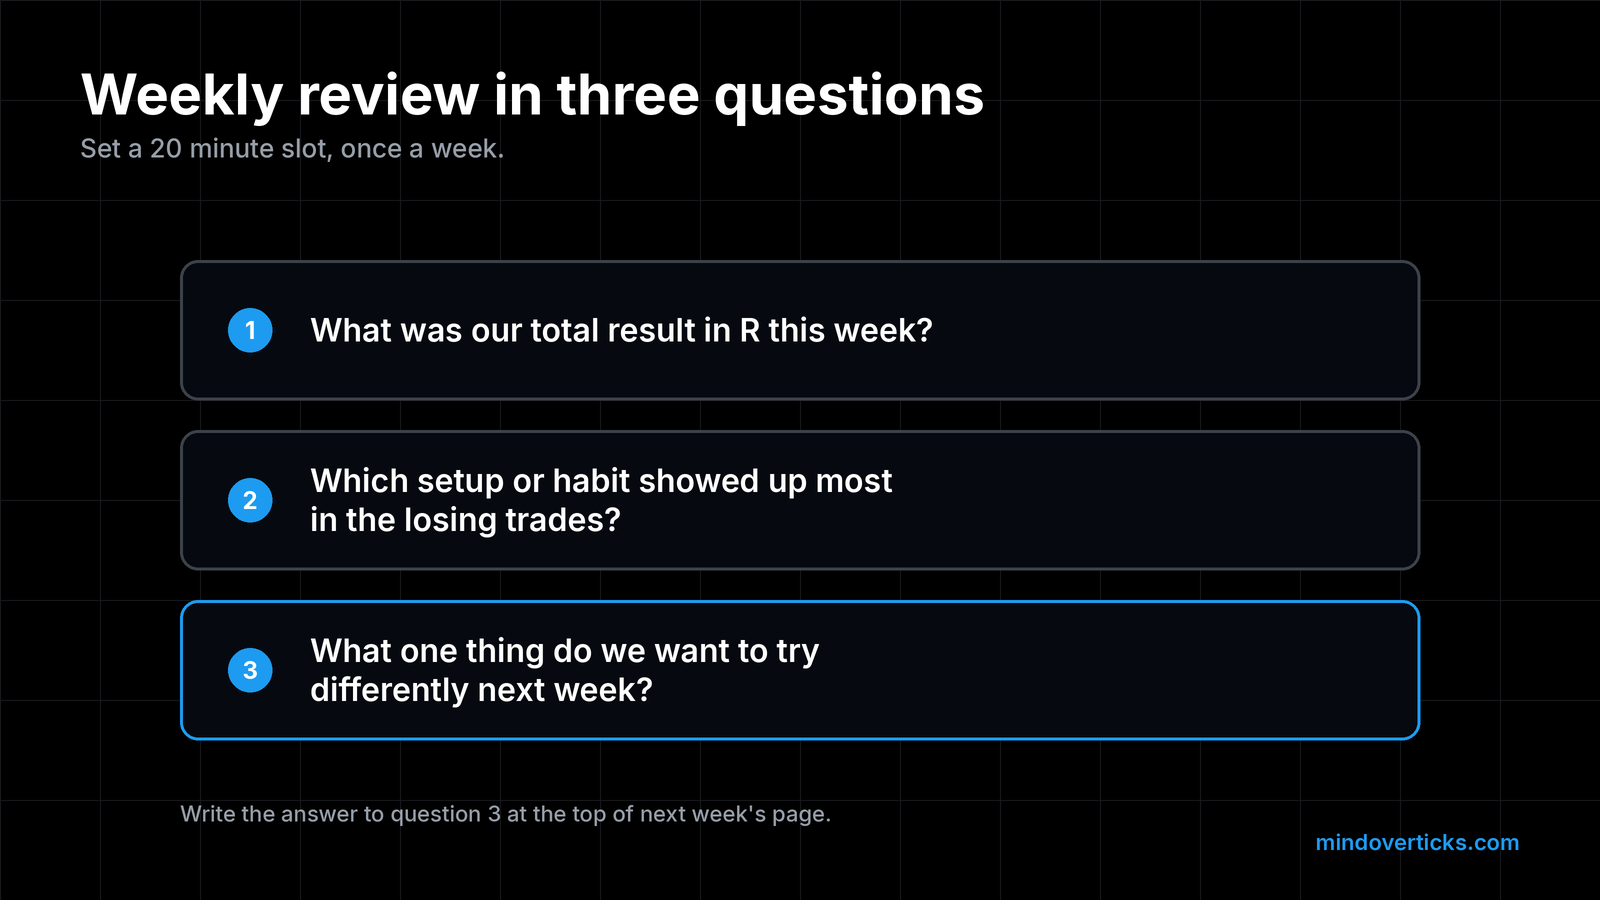
Reviewing every trade in the moment tends to turn into replaying it. A weekly review with a little distance is calmer. Set a 20 minute slot and answer three questions:
- What was our total result in R this week?
- Which setup or habit showed up most in the losing trades?
- What one thing do we want to try differently next week?
Write the answer to question 3 at the top of next week’s page.
Step 6: Look for patterns after 20 or so trades
A single week is a tiny sample. After a few weeks, filter the log. Compare “followed plan: yes” against “no.” Compare one setup against another. Check how long we held winners versus losers, the same pattern Odean studied. Count how many trades happened in the first half hour of the session. These comparisons are where a journal starts paying for itself.
A worked example (hypothetical numbers)
Here is one hypothetical entry, with a made-up ticker and prices, to show how short it can be:
| Field | Hypothetical entry |
|---|---|
| Date | Tue, 10:12 AM to 11:40 AM ET |
| Ticker, direction | XYZ, long |
| Setup | Bounce from support zone near $47.50 |
| Plan | Entry $50.00, stop $47.00, target $56.00 |
| Actual | In $50.05, out $55.80 |
| Size | 50 shares |
| Result | +$287.50, about +1.9R (planned risk $150) |
| Followed plan? | Mostly: exited at $55.80, just short of the $56.00 target |
| Feeling | Calm at entry, wanted to exit early around $53 |
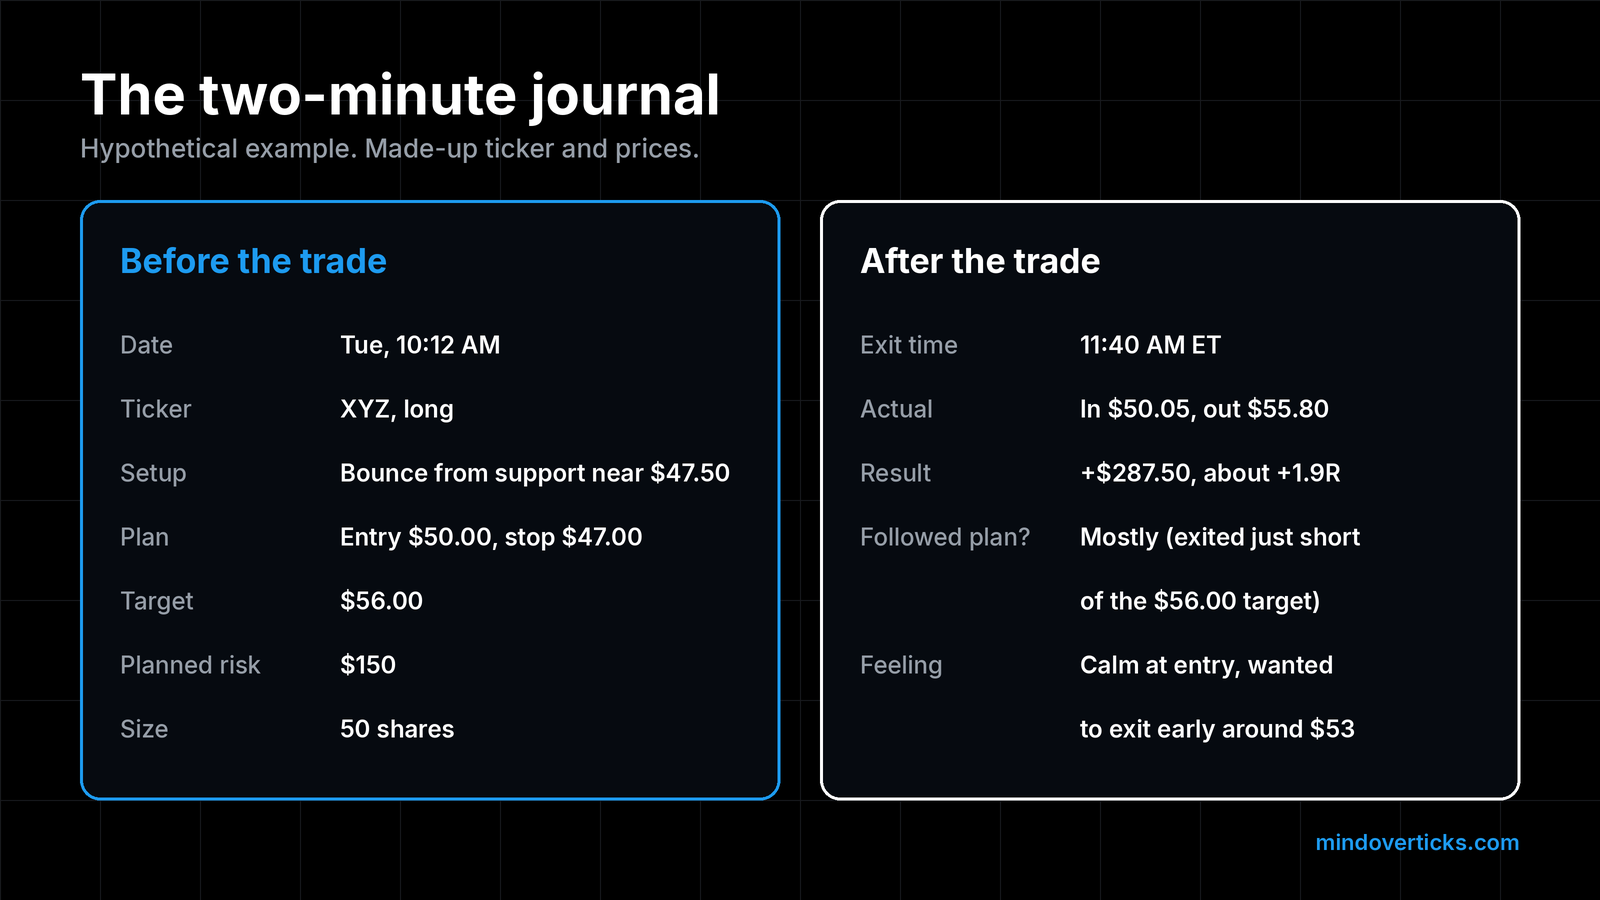
The last line is the gold. If “wanted to exit early” shows up again and again, that is a pattern worth working on.
The copy-and-paste template
DATE / TIME IN / TIME OUT:
TICKER / LONG OR SHORT:
SETUP (one phrase):

BEFORE THE TRADE
Planned entry:
Planned stop:
Planned target:
Planned risk ($):
Size:

AFTER THE TRADE
Actual entry:
Actual exit:
Result ($):
Result (R) = Result / Planned risk:
Followed plan? (yes / no):
One sentence on how it felt:

WEEKLY REVIEW (Fridays)
Total R this week:
Most common thread in losers:
One thing to try next week:
A spreadsheet works fine, and so does a paper notebook. The format matters far less than filling it in.
Keeping it going on bad days
The days we least want to journal are the days with the most to teach. Two small tricks help:
- Allow a minimum entry. On a rough day, the only required fields are result, followed plan, and the feelings line.
- Keep it out of sight of the chart. Filling it in away from live prices makes it easier to be honest.
If a losing streak shows up in the log, it helps to know how a fixed risk per trade cushions it. We cover that in the 1% rule, and the share math in position sizing in plain numbers.
This post is for education only and is not investment advice.
Sources
The template fields and review steps are our own design, not sourced research.
- Odean, T. (1998), “Are Investors Reluctant to Realize Their Losses?” Journal of Finance 53(5), abstract: https://faculty.haas.berkeley.edu/odean/papers%20current%20versions/areinvestorsreluctant.pdf (opened 2026-10-26; quotes verified word for word)
- Barber, B. and Odean, T. (2000), “Trading Is Hazardous to Your Wealth,” Journal of Finance, abstract: https://faculty.haas.berkeley.edu/odean/papers%20current%20versions/individual_investor_performance_final.pdf (opened 2026-10-26; quote verified word for word)
Drafted with AI assistance, then fact-checked and edited by the Mind Over Ticks team.
Up next · 6 minReading volume: what a big bar and a quiet bar are telling you