 Mind
Market Structure · Basics
Support and Resistance, Explained Simply
Support and resistance aren't magic lines. They're places where a lot of traders made decisions before, and may again.
· 6 min read
Educational only, not financial advice. See the full Disclaimer.
Open almost any chart and you'll see someone has drawn flat lines across it. Those are support and resistance. They're the first piece of market structure most traders learn, and they're also one of the most misused.
Here's what they actually are, why they sometimes work, and how to mark them without fooling yourself.
Terms we'll use
- Support: a price area where falling prices have stopped before, because buyers stepped in.
- Resistance: a price area where rising prices have stalled before, because sellers stepped in.
- Zone: a band of prices, not one exact number. Levels are fuzzy in real life.
- Breakout: price moves clearly through a level and stays there.
- False breakout: price pokes through a level, then quickly snaps back.
- Retest: after a breakout, price comes back to the old level to "check" it.
What support and resistance are
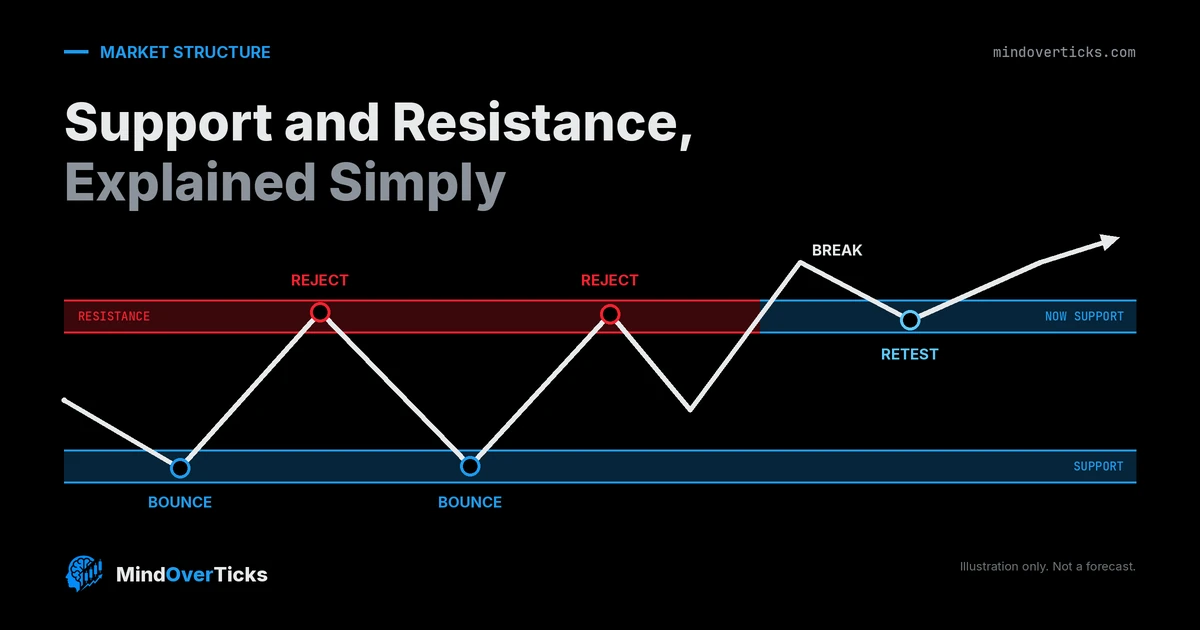
Think of a price chart as a record of decisions. If a stock fell to about $50 three times and bounced each time, a lot of people were willing to buy near $50. That area is support. If it rose to about $60 and turned back down twice, sellers were waiting there. That's resistance.
Nothing forces price to respect those areas. They just mark where buying or selling showed up before.
Why price reacts at a level
A few plain reasons:
- Memory. Traders who bought at $50 and saw it bounce remember. Traders who missed it may want in the next time it gets there.
- Waiting orders. People park buy orders, sell orders and stops near obvious levels and round numbers like $50 or $100.
- Regret. Someone who bought at $60 and watched it fall may sell when price gets back to $60, just to break even.
Is there evidence any of this matters? Some. Carol Osler, an economist at the Federal Reserve Bank of New York, tested the support and resistance levels that six currency trading firms sent their clients each morning from 1996 to 1998. The levels did a better job of predicting where intraday trends would stall than chance did. Some firms were noticeably better than others, and the levels kept some predictive power for at least five business days (Osler, 2000).
That's a useful finding, not a guarantee. "Trends tend to pause there" is very different from "price will bounce there."
Lines vs zones
Beginners draw a razor-thin line at $50.00, then panic when price trades at $49.80. Real levels are messy. Different traders see "$50" as $49.70 or $50.30.
So draw a zone: a short band that covers the cluster of turning points. A simple rule of thumb is to cover the wicks and closes near the level, and keep the band narrow enough that it still means something.
How to mark a level in 4 steps
- Zoom out first. Look at a daily chart before a 5-minute chart. Levels that show up on bigger timeframes are seen by more people.
- Find at least two clear turns at roughly the same price. One touch is a guess; two or three is a level.
- Shade the zone around those turns instead of picking one exact price.
- Write it in your plan before you trade: the level, what you'll do if it holds, what you'll do if it breaks, and where your stop goes. That's the "Plan" field in your trading journal.
When support becomes resistance
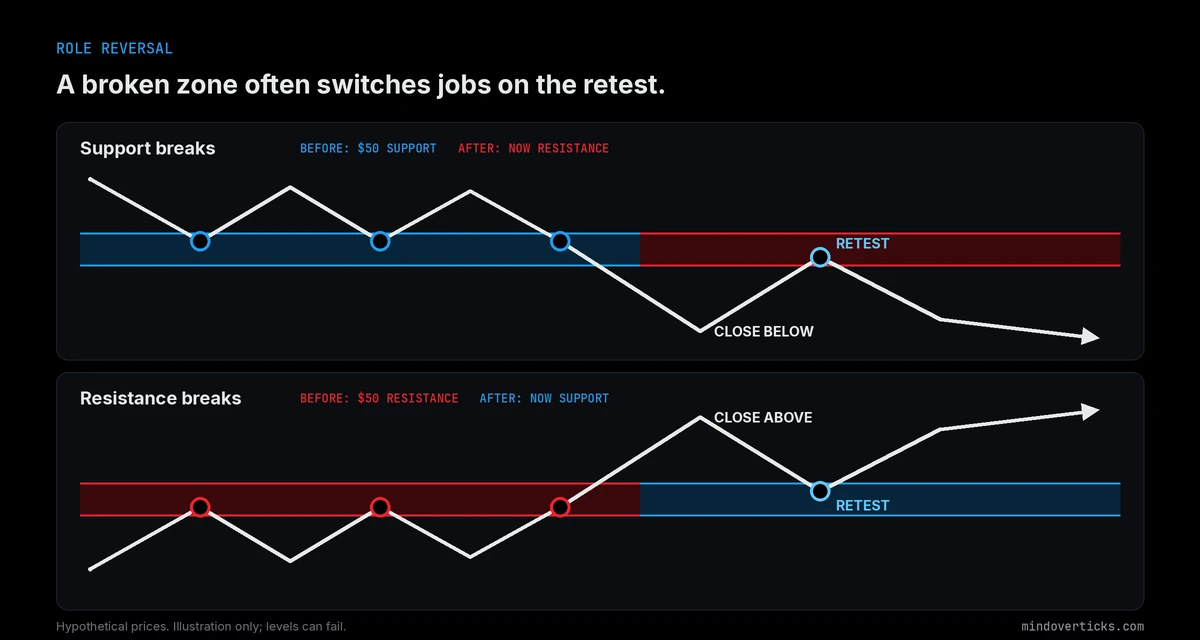
Here's the part that surprises people. When price breaks clearly below support, that old support often acts as resistance on the way back up. The buyers who got trapped below $50 are happy to sell at $50 to get out even. The same flip works in reverse: broken resistance often becomes support on a retest.
Hypothetical example: a stock bounces off $50 three times, then drops to $46. A week later it rallies back to $50 and stalls. Former support, now resistance.
Common mistakes
- Drawing too many lines. If your chart has twelve levels, every price is "near a level" and none of them mean anything. Keep the two or three most obvious.
- Treating a level as a promise. Levels break all the time. Every trade at a level still needs a stop, sized with something like the 1% rule.
- Stops exactly on the level. Obvious stops sit right below obvious support, and false breakouts often run them. Give your stop room beyond the zone, then size the position smaller to keep risk the same.
- Chasing every poke. A brief break that snaps back is a false breakout. Many traders wait for a close beyond the zone before calling it broken.
How to think about it
Support and resistance are a map of where people made decisions before. They tell you where to pay attention, not what will happen. Mark a few zones, plan for both outcomes, and let your stop and position size handle being wrong.
Takeaway
- Support is where falling prices stopped before. Resistance is where rising prices stalled.
- Draw zones, not razor-thin lines, and keep only the two or three most obvious.
- Broken support often turns into resistance, and the reverse.
- A level is a place to pay attention, not a promise. Always plan the stop and size first (see Markets for today's context).
Sources
- Osler, C. L. (2000). Support for resistance: Technical analysis and intraday exchange rates. Federal Reserve Bank of New York Economic Policy Review, 6(2), 53–68. newyorkfed.org
- TradingView Help Center. How to set up alerts.
Examples are hypothetical and for illustration only. Study findings are from the cited paper (currency markets, 1996–1998). Educational only, not financial advice. See the full Disclaimer.
Up next: How to Keep a Trading Journal You'll Actually Use · Share on X · Follow @MOT_HQ