 Mind
Payment for Order Flow: How to Read a Rule 606 Report
Educational only, not financial advice (disclaimer).
By Mind Over Ticks editorial team
This post contains an affiliate link. We earn a commission if you buy through it.
For the same kind of order in April 2026, Robinhood reported getting roughly 18 to 28 times as much per share from its top wholesalers as Fidelity did (our math): about 78 to 117 cents per 100 shares on S&P 500 market orders, against about 4.2 to 4.3. That money is payment for order flow, and every broker must disclose it in a quarterly Rule 606 report.
Both numbers come from the Rule 606 report, a free quarterly disclosure most traders have never opened.
Payment for order flow: the short answer
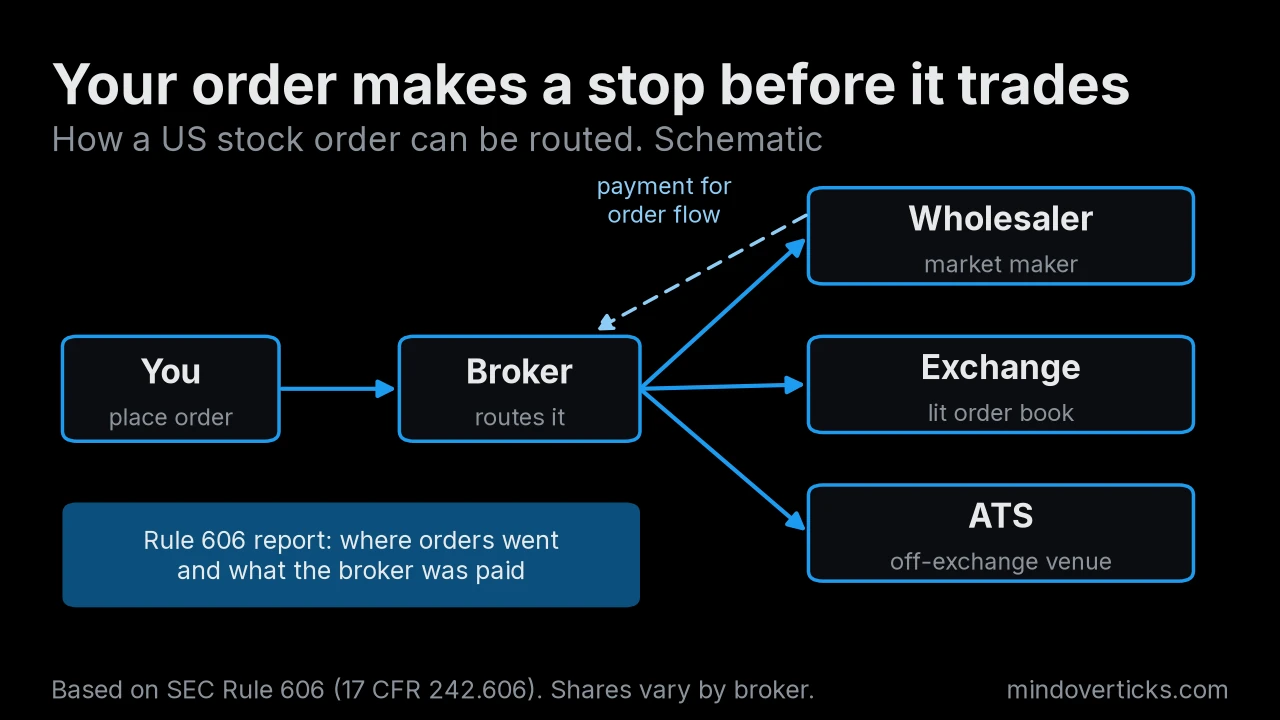
A 606 report shows where your broker routes your stock and options orders and what each venue paid it, including payment for order flow. It does not show how good your fills were; that lives in separate Rule 605 reports.
What the rule requires
Rule 606(a)(1) requires every broker or dealer to publish a quarterly report on its routing of non-directed held orders in NMS stocks and customer options orders, “broken down by calendar month,” and keep it on a free public website “for a period of three years” (17 CFR 242.606).
- Non-directed means you did not pick the venue.
- Held orders are covered; not-held orders get a separate report on request.
- Quarterly, by month, due within one month after the quarter ends.
The current version comes from the SEC’s 2018 release, Disclosure of Order Handling Information (Release 34-84528), effective January 18, 2019 (SEC). After delays, the first reports, covering the first quarter of 2020, were due by May 29, 2020 (SEC).
What is in each report
Each report has three sections: S&P 500 stocks, other NMS stocks, and options. Each shows:
- The order mix: market, marketable limit, non-marketable limit and other.
- The venues: the top ten by non-directed orders, plus any at 5% or more.
- The money: for each venue, “the net aggregate amount of any payment for order flow received, payment from any profit-sharing relationship received, transaction fees paid, and transaction rebates received, both as a total dollar amount and per share.”
- The relationships: a written discussion of material terms with each venue.
Item 3 is netted, so a figure can be zero or negative. The SEC’s format shows the per-share figure as cents per 100 shares, which both tables below use.
Where to find your broker’s report
On your broker’s own site, and at FINRA: “FINRA Rule 6151 requires every member obligated to publish a Rule 606(a) Report to provide the report to FINRA for publication on FINRA’s website” (FINRA). The SEC itself does not host the reports.
| Broker | Where the 606 report lives |
|---|---|
| Fidelity | fidelity.com 606 page, PDF and XML, “published no later than one month after the end of the quarter” |
| Robinhood | RHS SEC Rule 606 and 607 Disclosure (PDF), linked from robinhood.com legal |
One month, two brokers: April 2026
From both brokers’ Q2 2026 reports, the latest both had to publish; Q3 reports are not due until about October 31, 2026. We show April only, S&P 500 stocks, market-order payments only.
Robinhood Securities, S&P 500 stocks, April 2026 (report, generated July 28, 2026)
Non-directed orders: 100% of orders. Mix: market 43.30%, marketable limit 13.91%, non-marketable limit 32.95%, other 9.84%.
| Venue | % of non-directed orders | Net payment received, market orders (USD) | Cents per 100 shares |
|---|---|---|---|
| Virtu Americas | 35.62 | 772,056.10 | 96.3094 |
| Citadel Securities | 27.38 | 625,328.42 | 78.0852 |
| G1 Execution Services | 13.79 | 663,236.03 | 105.0548 |
| Jane Street Capital | 13.19 | 567,312.97 | 116.5234 |
| Hudson River Trading | 5.20 | 209,828.49 | 84.8218 |
Robinhood says the payment is “12.35% of the spread during the regular market hours”, with 9% in extended hours and $0.0006 per share from 8 p.m. to 4 a.m. ET. It also says “RHS passes 80% of such revenue to RHF.”
Fidelity Brokerage Services, S&P 500 stocks, April 2026 (Q2 2026 XML)
Non-directed orders: 96.64% of orders. Mix: market 53.36%, marketable limit 6.32%, non-marketable limit 36.45%, other 3.88%.
| Venue | % of orders | Net payment received, market orders (USD) | Cents per 100 shares |
|---|---|---|---|
| Citadel Securities | 16.74 | 102,696 | 4.2124 |
| Virtu Americas | 16.19 | 101,763 | 4.2239 |
| CrossStream ATS | 14.29 | 0 | 0 |
| Jane Street Capital | 12.58 | 93,843 | 4.3050 |
| G1 Execution Services | 12.34 | 92,810 | 4.3093 |
| Nasdaq | 8.81 | -1,652 | -14.5002 |
| NYSE | 5.73 | 0 | 0 |
Fidelity’s April report lists ten venues; we show those at 5% or more. Nasdaq’s -$1,652 means Fidelity paid the exchange more in fees than it got back.
Side by side
| April 2026, S&P 500, market orders | Robinhood | Fidelity |
|---|---|---|
| Top venue share of orders | 35.62% (Virtu) | 16.74% (Citadel) |
| Top two / top four venues | 63% (top two) | 59.80% (top four) |
| Payment from top venues, cents per 100 shares | about 78 to 117 | about 4.2 to 4.3 (wholesalers); 0 CrossStream, NYSE; negative at Nasdaq |
A broker that receives more per share could give better, worse or similar fills; the 606 report cannot tell you which.
What a 606 report does not tell you
- Fill quality. Price improvement, speed and fill prices are in Rule 605 reports, monthly execution statistics from market centers and certain brokers (FINRA). SEC amendments adopted in 2024 widen Rule 605 to larger brokers and add a summary report, with compliance from August 1, 2026 (SEC).
- Every venue or order. Only the top ten plus any venue at 5% or more; directed and not-held orders are left out.
- What happened next. It shows the first destination, not where that venue sent the order after.
- Marketing claims. A broker’s headline price-improvement figure is not a 606 field.
Your own orders, on request
Under Rule 606(b), a broker must tell you on request the venue each of your held orders went to over the prior six months, and remind customers at least once a year that this is available. For not-held orders, a more detailed report must be delivered “within seven business days of receiving the request.”
Read yours in five minutes
- Open your broker’s latest 606 report or its FINRA copy.
- Pick the S&P 500 section for large caps, other NMS stocks otherwise.
- Check the order mix, then the percent sent to each venue.
- Read the payment columns, then the written discussion of each relationship.
Limits
We show one month, one order type and one stock section; May, June, limit orders and other NMS stocks may differ.
Further reading
Larry Harris’s Trading and Exchanges is a standard textbook on market structure. See it on Amazon (affiliate link). As an Amazon Associate we earn from qualifying purchases.
Related: Volume vs liquidity.
How this was made: researched and drafted with AI tools from cited sources, then fact-checked and edited under our editorial standards. See our Editorial Process page.
Mind Over Ticks publishes general education, not personalized investment advice. We do not know your situation. Talk to a licensed professional before acting. Nothing here is a recommendation of any broker.