 Mind
Volume vs Liquidity: What Free SEC Data Shows Traders
Educational only, not financial advice (disclaimer).
By Mind Over Ticks editorial team
This post contains an affiliate link. We earn a commission if you buy through it.
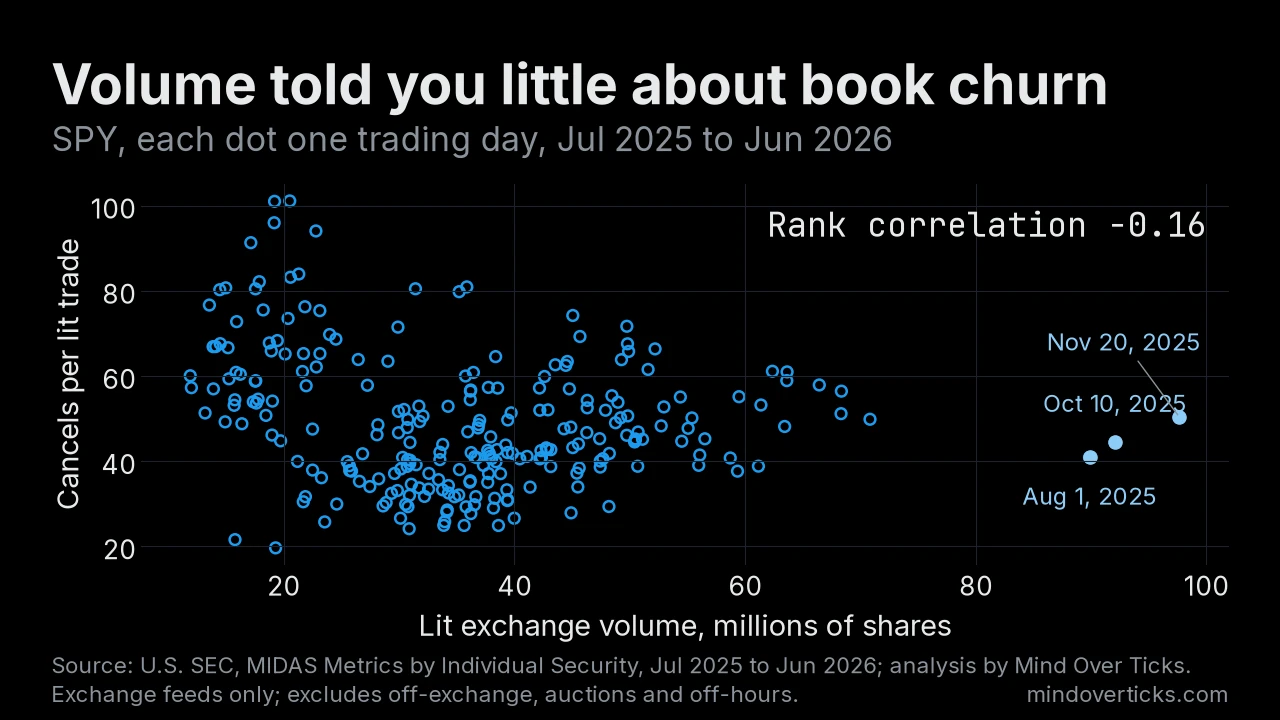
SPY traded a median 40.1 million shares a day on exchange over the past year, with 46.9 cancel messages (full or partial) for every trade on its lit book. A small industrial stock trading about 70,000 shares a day saw 13.7. That gap is the volume vs liquidity problem: heavy trading does not guarantee a clean, cheap book.
Volume tells you how much traded. Liquidity is what it cost and how much size the book would take without moving: spread, depth and price impact.
The data
The SEC publishes free daily market structure data, called MIDAS, for every exchange-listed stock and ETF (SEC). We used July 1, 2025 to June 30, 2026: 251 trading days and 9,727 securities.
The dataset has no prices. We used three order-book measures, as defined in the SEC’s documentation:
- Cancels per trade: cancel messages divided by lit trades. High means most quotes are pulled before anything trades.
- Trade-to-order volume: lit volume as a percent of the volume of orders added to the book. Low means a lot of size is posted for each share that trades.
- Odd-lot share: percent of trades under 100 shares.
Volume vs liquidity: more helps, then stops
We split stocks each day into ten groups by on-exchange volume and took the median of each measure.
| Volume decile | Median daily volume (shares) | Median cancels per lit trade |
|---|---|---|
| 1 (lowest) | 134 | 4,184 |
| 2 | 940 | 1,802 |
| 3 | 2,852 | 874 |
| 4 | 7,638 | 324 |
| 5 | 21,032 | 77 |
| 6 | 55,200 | 24 |
| 7 | 126,530 | 17 |
| 8 | 276,291 | 15 |
| 9 | 629,300 | 14 |
| 10 (highest) | 2,336,967 | 16 |
Cancels per trade fall from 4,184 in the bottom decile to about 17 by the seventh, then go flat. A stock trading 2.3 million shares a day shows about the same cancel rate as one trading 127,000. Trade-to-order volume tells the same story, rising from 0.001% to about 4% by decile 9.
Past roughly 125,000 shares a day on exchange, more volume did not buy a more efficient-looking book.
Finding 2: the busiest name is not the cleanest book
Eight names, chosen to span volume tiers:
| Ticker | Median daily volume (shares) | Cancels per lit trade | Trade-to-order volume | Odd-lot share |
|---|---|---|---|---|
| SPY | 40.1M | 46.9 | 1.2% | 48% |
| AAPL | 15.5M | 19.8 | 4.2% | 70% |
| F | 15.6M | 12.0 | 3.5% | 34% |
| AA | 2.3M | 14.7 | 4.5% | 70% |
| SIRI | 1.3M | 15.4 | 4.3% | 61% |
| ASTE | 69,750 | 13.7 | 2.7% | 90% |
| CRMT | 56,610 | 14.3 | 3.1% | 88% |
| HBB | 7,954 | 31.6 | 1.2% | 93% |
SPY has the most volume and one of the highest cancel rates. Our analyst reads that as fast market making: lots of quotes posted and pulled around what is usually described as a deep book.
In ASTE, CRMT and HBB, 88% to 93% of trades were under 100 shares, against 34% for F. A volume bar there is built from tiny prints, and a 2,000-share order is a different problem from the bar’s height.
Finding 3: busy days look tidier, loosely
For 95% of 6,965 securities, higher-volume days had fewer cancels per trade, with a median rank correlation of -0.39. For 98%, they also had a lower odd-lot share (median -0.54).
A correlation of -0.39 is moderate: volume is a clue to book activity, not a reading of it.
Finding 4: event days are mixed
Volume change against normal days, selected names (full results on file):
| Day type (days) | Volume up | Volume down |
|---|---|---|
| Month end (12) | SPY +7%, AAPL +12%, SIRI +32%, HBB +18% | AA -23%, CRMT -12% |
| Holiday week (16) | CRMT +41% | F -37%, HBB -30% (HBB cancels per trade +51%) |
| Rebalance (5) | SPY +13% |
Holiday weeks cut volume in names such as F and HBB. In HBB, a thin name, cancels per trade rose 51% at the same time, so volume and book behavior moved in opposite directions.
A rebalance day is the last session before an index change takes effect; each day gets one label, month end first, then rebalance, then holiday week.
What it can’t tell you: cost
A widely used daily illiquidity measure is the Amihud ratio (Amihud 2002): absolute daily return divided by dollar volume, averaged over days. It needs daily prices, and every free price source we checked bars publishing derived results, so here it is with made-up numbers.
The same 1% move took 100 times less money in Stock B. Higher Amihud means less liquid.
Limits
- These measures describe activity on the book. They are not spreads or trading costs, and a high cancel rate alone says nothing about whether a name is costly to trade.
- On-exchange, continuous-session data only, from the SEC’s order-based exchanges. The SEC notes its volume metrics “generally exclude off-exchange trading, trading at the opening and closing auctions, and any off-hours trading” (SEC MIDAS FAQ), so this is not the consolidated number on your chart.
- Much month-end and rebalance volume trades in the closing auction, which MIDAS excludes, so event-day ratios likely understate event-day volume. Event samples are small (12, 16 and 5 days) and untested for significance.
- One year, one market regime; securities enter and leave as they list and delist.
- Focus tickers were hand-picked, not random, so they illustrate rather than prove.
- The analysis and conclusions are ours; the SEC has not reviewed or endorsed them. The code, data checksums and full results are on file.
Further reading
Larry Harris’s Trading and Exchanges is a standard textbook on market microstructure and liquidity. See it on Amazon (affiliate link). As an Amazon Associate we earn from qualifying purchases made through links in this post.
How this was made: researched and drafted with AI tools from cited sources, then fact-checked and edited under our editorial standards. See our Editorial Process page.
Mind Over Ticks publishes general education, not personalized investment advice. We do not know your situation. Talk to a licensed professional before acting.