 Mind
Where to put a stop: use structure, not a round number
A good stop sits where our trade idea is proven wrong, not where the math looks tidy.
Educational only, not financial advice (disclaimer).
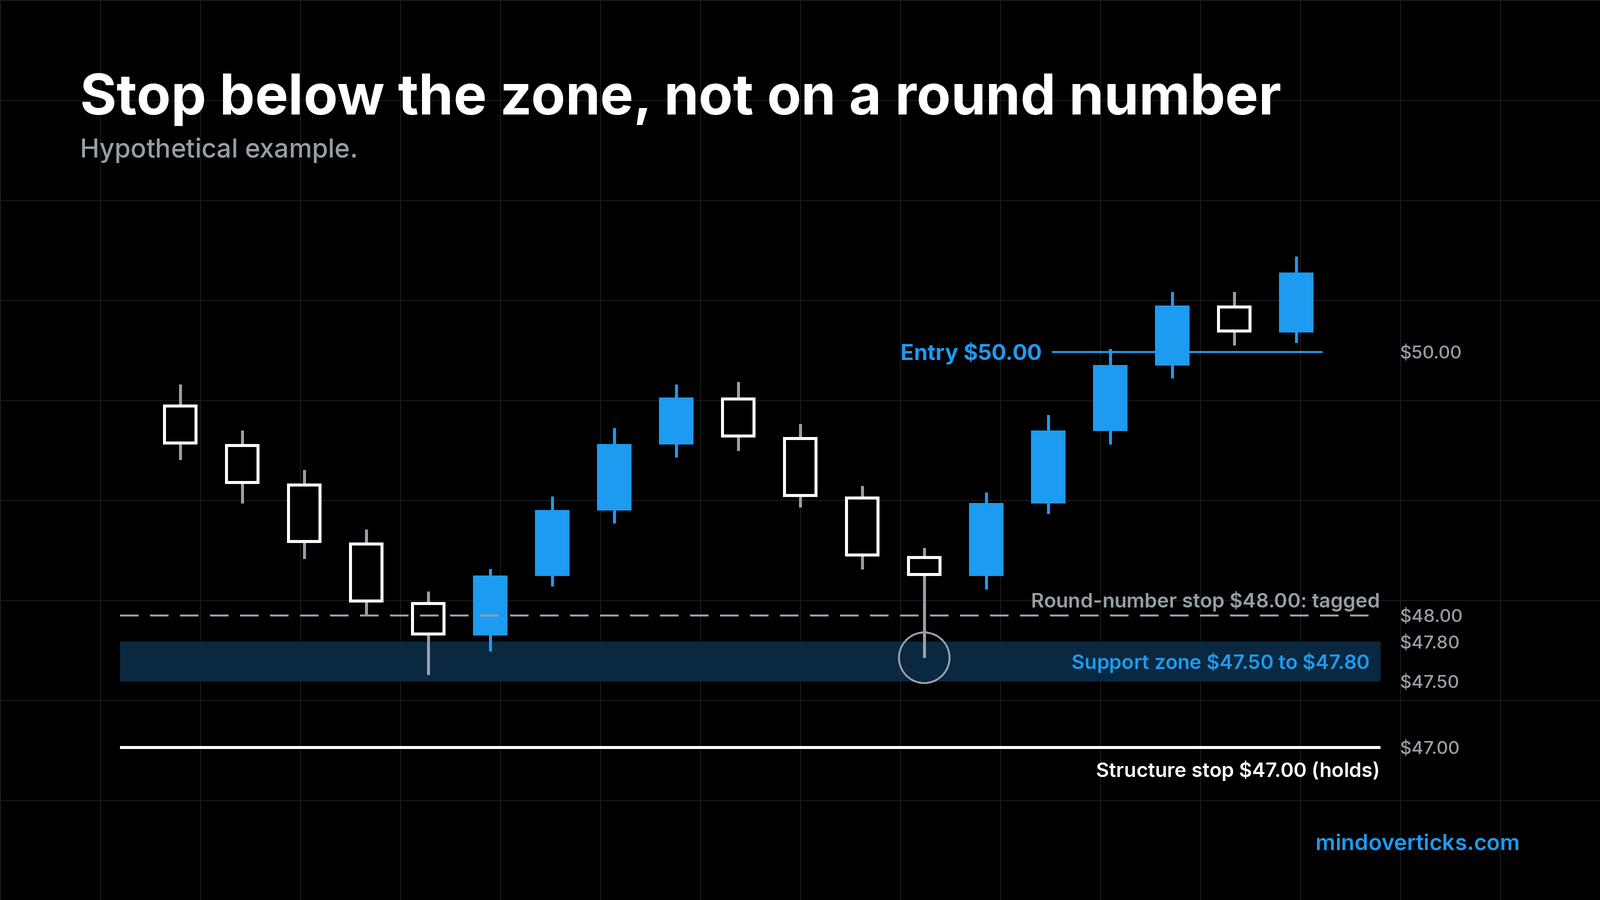
Most of us pick our first stop the easy way. Say we buy at $50 and put the stop at $48 because two dollars feels sensible. Or we use “5 percent below entry” because someone said so. Then price dips to $47.90, takes us out, and climbs right back to where we expected it to go.
That sting usually is not bad luck. The stop sat where the number looked neat, not where our trade idea stopped making sense. Let’s walk through a calmer way to choose.
What a stop order actually does
Investor.gov, the SEC’s investor site, describes a stop order, “also referred to as a stop-loss order,” as “an order to buy or sell a stock once the price of the stock reaches the specified price, known as the stop price.” It adds: “When the stop price is reached, a stop order becomes a market order” (Investor.gov, Types of Orders).
Two things follow from that:
- A sell stop sits below the current price. Investor.gov notes that investors “generally use a sell stop order to limit a loss or protect a profit on a stock they own.”
- Because it becomes a market order, the fill can land below the stop price. A market order “does not guarantee the execution price,” per the same page.
FINRA’s rulebook says the same thing in formal terms: a stop order “becomes a market order to buy (or sell) when a transaction occurs at or above (below) the stop price” (FINRA Rule 5350).
So a stop is a trigger. Where we put that trigger is the whole game.
Why round numbers and fixed percentages fall short
Investor.gov names the main drawback of stops plainly: “The disadvantage is that a stop price purchase or sale could be activated by a short-term fluctuation in a stock’s price” (Investor.gov, Stop Order). A stop parked inside normal wiggle room invites exactly that.
A round number or a flat percentage has nothing to do with the chart in front of us. It is the same whether the stock is quiet or jumpy, and whether there is a clear floor nearby or none at all.
Here is the problem in one hypothetical example, with made-up numbers:
| Hypothetical stock | Typical daily range | Stop 2% below a $50 entry |
|---|---|---|
| Quiet stock | about $0.50 | $49.00, outside normal noise |
| Jumpy stock | about $2.50 | $49.00, inside a normal day’s wiggle |
The same $49.00 stop is roomy on one chart and cramped on the other. The number did not change. The stock did.
Structure: let the chart tell us where we’re wrong
This is our method, a common practitioner approach rather than a research finding. We are not aware of a study that proves it beats other ways of placing stops. “Structure” just means the levels price has already respected. The most common one for a long trade is support.
Support is a price area where a falling stock has turned back up before, because buyers kept stepping in there. For a long trade, it is a natural place to anchor a stop.
The logic is simple. If we buy because buyers keep defending, say, $47.50, then a clean break below $47.50 means our reason for the trade is gone. That is where the stop belongs: a little beyond the level, not right on it.
Think in zones, not exact lines
Support is rarely a single penny. It is usually a band of prices rather than one exact line. So we mark the zone where price turned before, then place the stop just past the bottom of that zone.
How much room to give: a volatility buffer
“A little beyond the level” needs a number. One common yardstick is the average true range, or ATR.
The ATR comes from J. Welles Wilder Jr.’s 1978 book New Concepts in Technical Trading Systems. It is the average of each day’s true range (the full distance price covered, including any gap from the prior close) over a set number of days. In plain words, it tells us how far the stock typically travels in a day.
A buffer of a fraction of the ATR beyond the support zone helps keep ordinary noise from tagging us. How big a fraction is a personal choice we can test in our journal; there is no single correct multiple.
A worked example (hypothetical numbers)
Every number here is hypothetical, not a real stock or a recommendation.
- We like a stock at $50.00 because it bounced twice from a zone between $47.50 and $47.80.
- Its ATR is $1.00.
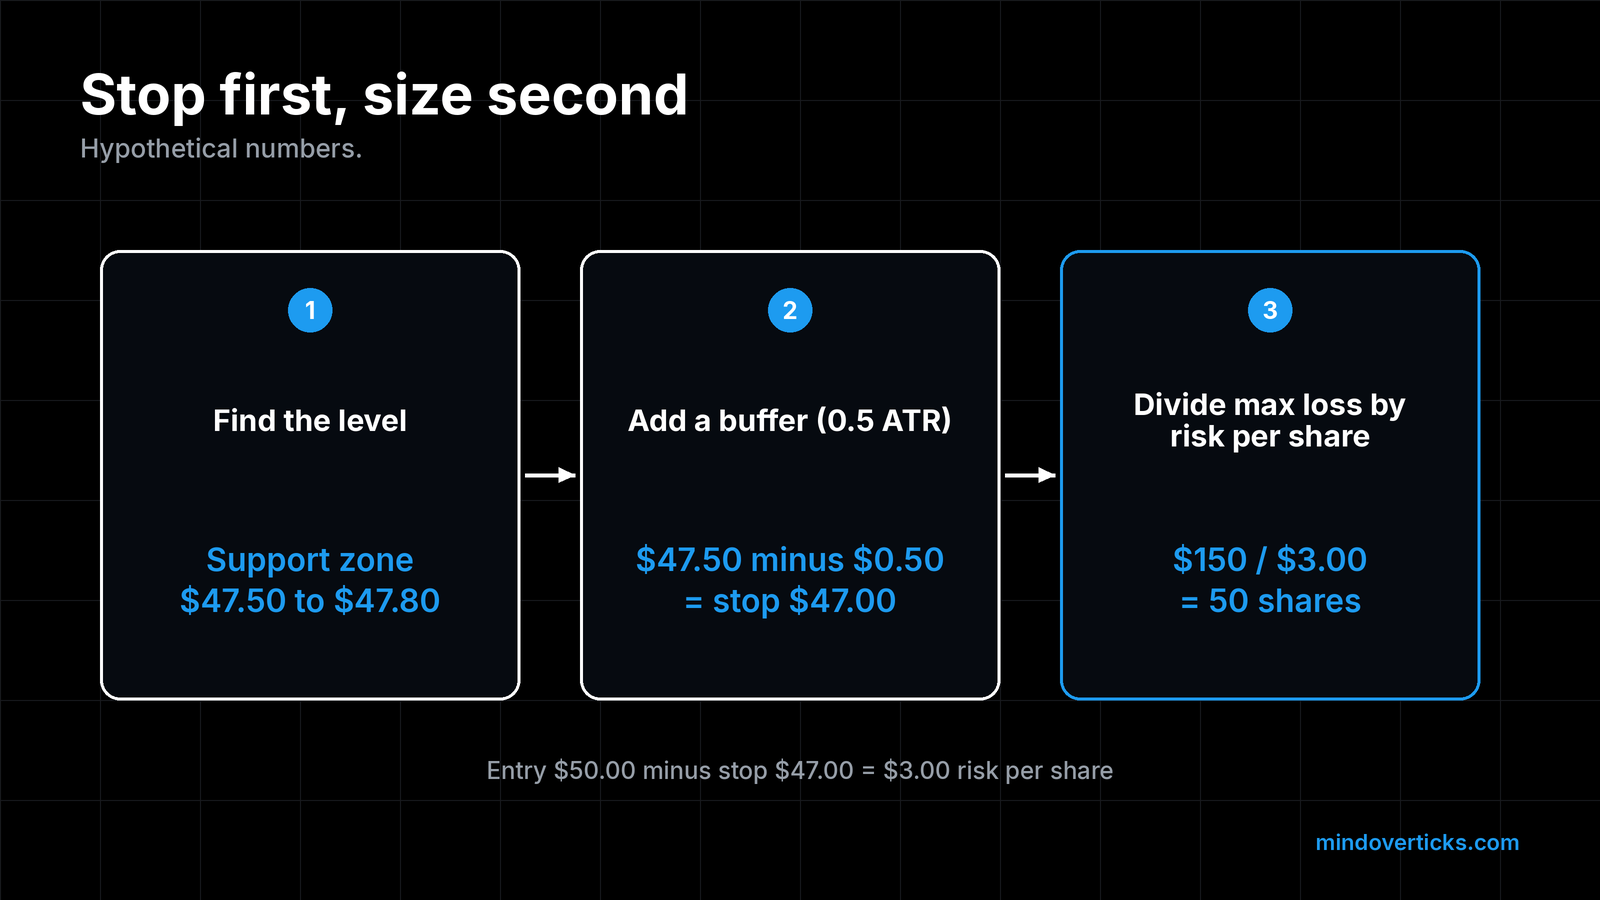
- We place the stop half an ATR below the zone: $47.50 minus $0.50 equals $47.00.
- Our risk per share is $50.00 minus $47.00, which is $3.00.
Notice what happened. The stop came from the chart first. Only after that did we learn our risk per share.
Then size the trade around the stop
This is the step that makes structure-based stops workable. A wider stop does not have to mean a bigger loss, because we can buy fewer shares.
Continuing the hypothetical example: if we decide ahead of time that one trade may cost us at most $150, then $150 divided by $3.00 risk per share equals 50 shares. If the structure had allowed a $1.50 stop instead, the same $150 would allow 100 shares.
We cover the full math in position sizing in plain numbers and why a small fixed slice of the account matters in the 1% rule.
When there is no clear structure
Sometimes the chart has no obvious floor near our entry. That is useful information too. If the nearest real level is so far away that the share count shrinks to almost nothing, passing on the trade is a perfectly reasonable outcome. Skipping a trade costs nothing.
Gaps can still jump the stop
Structure helps us pick a sensible trigger, but it cannot guarantee the exit price. Investor.gov warns that “the price at which your trade is executed may differ from the stop price, especially in a fast-moving market where stock prices can change rapidly” (Investor.gov, Stop Order). A stock that opens well below our stop can fill well below it. Sizing the position so that a worse fill is survivable is part of the plan, not an afterthought.
Write the stop down before entering
A stop chosen in the heat of a trade tends to drift. Writing the entry, the level, the buffer and the stop in our trading journal before we click buy keeps the decision honest, and gives us data to review later.
This post is for education only and is not investment advice.
Sources
- FINRA Rule 5350, Stop Orders: https://www.finra.org/rules-guidance/rulebooks/finra-rules/5350 (opened 2026-10-26)
- Investor.gov (SEC), Glossary, Stop Order: https://www.investor.gov/introduction-investing/investing-basics/glossary/stop-order (opened 2026-10-26)
- Investor.gov (SEC), Types of Orders: https://www.investor.gov/introduction-investing/investing-basics/how-stock-markets-work/types-orders (opened 2026-10-26)
- Wilder, J. W. (1978), New Concepts in Technical Trading Systems (ATR origin; book, not quoted): https://openlibrary.org/isbn/0894590278
Drafted with AI assistance, then fact-checked and edited by the Mind Over Ticks team.
Up next · 7 minMarket, Limit and Stop Orders: Which One to Use, and What Each One Costs You