 Mind
Reading volume: what a big bar and a quiet bar are telling you
A volume bar tells us how many people showed up, not which way they were leaning.
Educational only, not financial advice (disclaimer).
Most of us notice the volume bars at the bottom of a chart long before we know what to do with them. One day a bar shoots up three times taller than its neighbors and it feels like a signal. Another day the bars barely rise off the floor and the chart feels dead. It is tempting to read both as a hint about where price goes next.
Volume is more modest than that, and more useful once we see what it really measures. Let’s look at what a big bar and a quiet bar can and cannot tell us.
What volume actually counts
Nasdaq’s glossary defines volume this way: “This is the daily number of shares of a security that change hands between a buyer and a seller. Also known as volume traded” (Nasdaq Glossary).
On an intraday chart, each bar counts the shares traded during that bar’s time window instead of a full day, but the idea is the same.
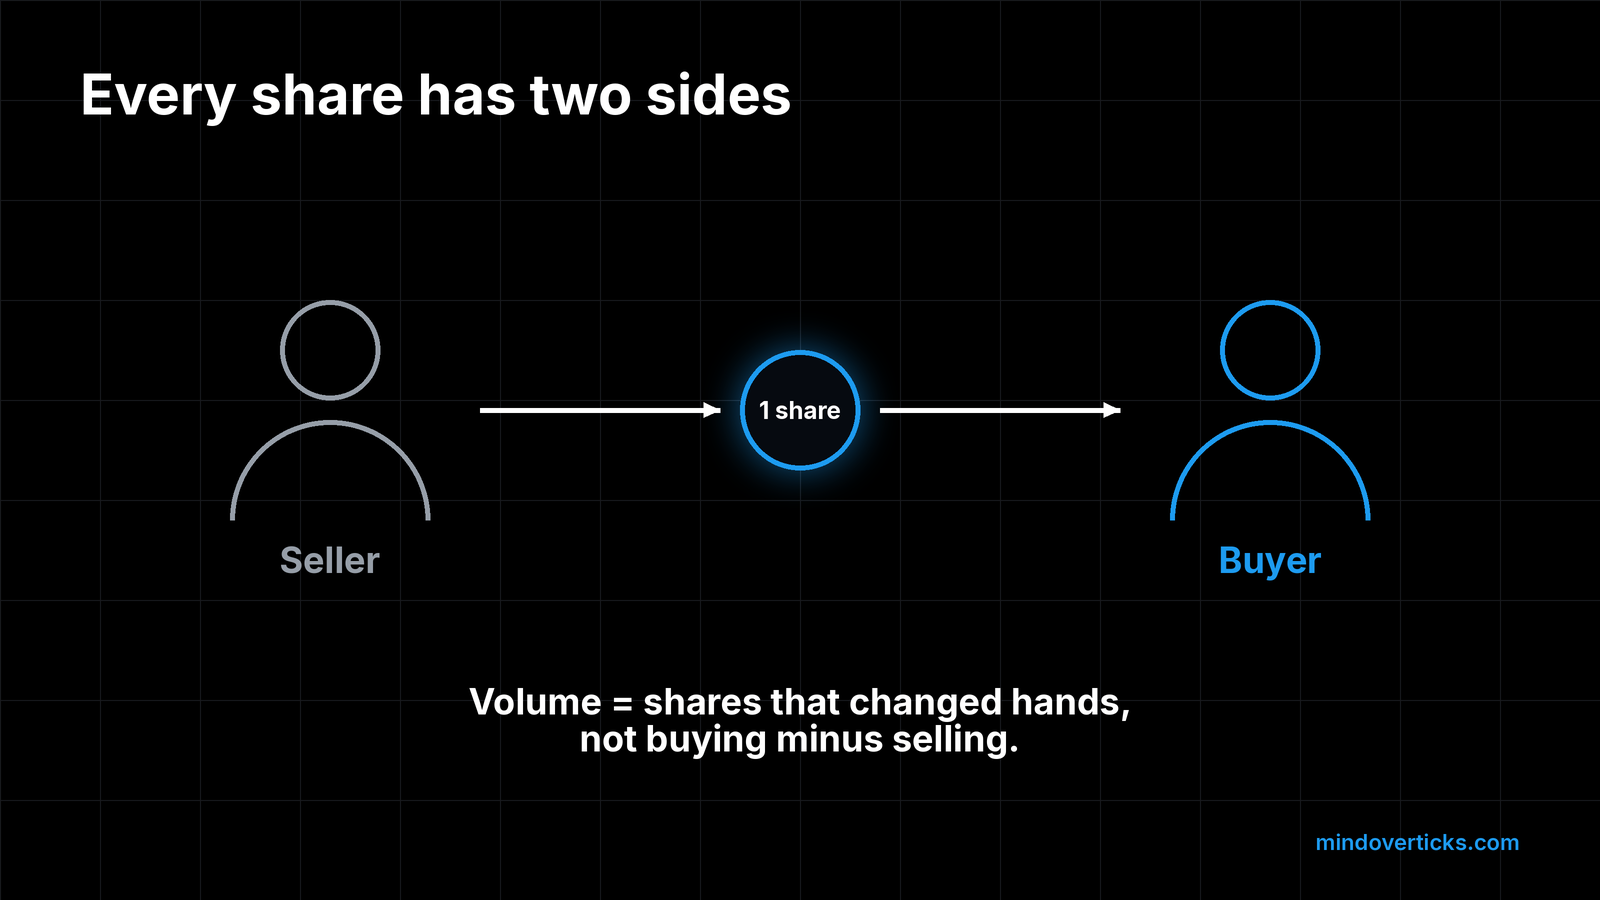
Here is the part beginners often miss. Every share that changes hands has a buyer and a seller. A tall volume bar does not mean “lots of buying.” It means lots of shares traded, with exactly as many sold as bought.
Why we compare a bar to its own history
A bar of 2 million shares might be huge for one stock and sleepy for another. So the useful question is not “is this number big?” but “is this big for this stock?”
That comparison is often called relative volume: today’s volume divided by the stock’s own average over a recent stretch. Here is a hypothetical example with made-up numbers:
| Hypothetical day | Shares traded | 30-day average | Relative volume |
|---|---|---|---|
| Quiet day | 600,000 | 1,500,000 | 0.4x |
| Normal day | 1,500,000 | 1,500,000 | 1.0x |
| Big day | 4,500,000 | 1,500,000 | 3.0x |
Many charting platforms can draw a moving average line across the volume bars, which makes the comparison visual at a glance.
What a big bar is telling us: attention
The clearest research on unusually heavy volume is about attention. Brad Barber and Terrance Odean studied which stocks individual investors buy and wrote that “abnormal trading volume is our single best indicator of attention. Returns come in second” (Barber and Odean, 2008, “All That Glitters,” Review of Financial Studies, printed p. 803).
So when we see a bar several times taller than normal, the honest reading is: a lot of people were paying attention to this stock today. Often there is a reason, such as earnings, news, or a big move in the broader market. The bar is an invitation to go find out what happened.
What the bar does not tell us is where price goes next. Heavy volume shows up on rallies, on selloffs, and on days that go nowhere. We treat it as a measure of participation, not a forecast.
What a quiet bar is telling us: fewer people showed up
A low bar means fewer shares changed hands than usual. That can simply mean nothing new happened. It can also mean a holiday week, a slow lunch hour, or a stock that is out of the headlines.
Quiet does not mean unimportant. The same Barber and Odean study found that institutional money managers behaved differently from individuals here: “Overall, these institutional investors exhibit the opposite tendency of the individual investors: Their buy-sell imbalances are greater on low-volume days than high-volume days” (Barber and Odean, 2008, printed p. 798). In plain words, professionals in that sample leaned more toward net buying on quiet days, while individuals leaned in on the loud ones.
We read that as a gentle reminder: the loudest days are not the only days that matter.
A practical way to read volume on our own charts
This is our method, a simple routine rather than a research finding:
- Find the normal. Glance at the last 20 to 30 bars, or add a volume moving average, so we know what typical looks like.
- Flag the outliers. Notice bars well above or well below that normal.
- Ask why. For a big bar, check the news and the calendar. For a quiet one, check whether the whole market was quiet.
- Pair it with price, without predicting. Note what price did on that bar: wide range or narrow, closed near the high or the low. Volume plus price describes what happened. Neither one guarantees what comes next.
- Write it down. A note in our trading journal like “entered on a 3x volume day after news” (a hypothetical example) lets us check later whether those trades work for us.
A worked example (hypothetical numbers)
Every number here is hypothetical, not real market data.
Hypothetical stock XYZ normally trades about 1.5 million shares a day. On Tuesday it trades 4.5 million, or 3.0x normal, after an earnings report. Price moves up $2, then fades to close only $0.40 higher.
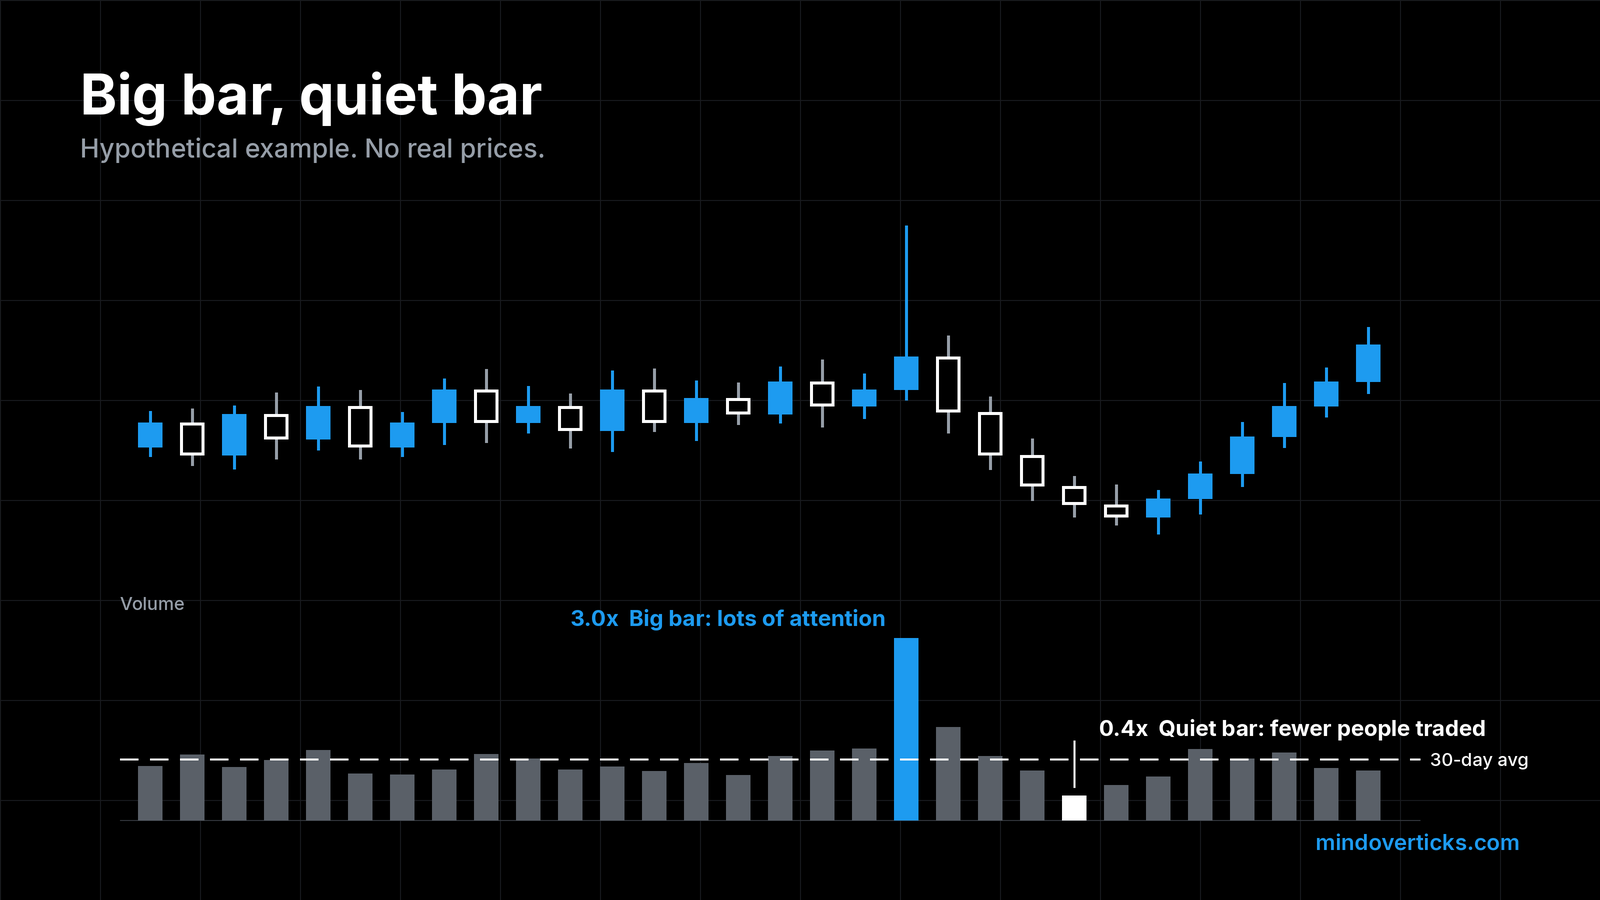
What can we say? Attention was very high, and plenty of shares traded at both higher and lower prices. That is all. If we decide to trade XYZ, we still place the stop from the chart’s structure, as in where to put a stop, and size it so a loss stays small, as in position sizing in plain numbers. A busy day can also mean faster price swings, so a wider stop with fewer shares is worth considering.
Common misreadings to set aside
- “Big green bar means buyers won.” Every share had a buyer and a seller. Volume does not have a side.
- “Quiet means safe.” Low participation can come before news just as easily as before more quiet.
- “One spike changes everything.” A single day is one data point. Patterns across many days, logged in a journal, tell us more.
This post is for education only and is not investment advice.
Sources
- Nasdaq Glossary, “Volume”: https://www.nasdaq.com/glossary/v/volume (opened 2026-10-26; quote verified word for word)
- Barber, B. and Odean, T. (2008), “All That Glitters: The Effect of Attention and News on the Buying Behavior of Individual and Institutional Investors,” Review of Financial Studies 21(2), doi:10.1093/rfs/hhm079. PDF: https://faculty.haas.berkeley.edu/odean/papers%20current%20versions/allthatglitters_rfs_2008.pdf (opened 2026-10-26; quotes verified word for word, printed pp. 798 and 803).
- Relative volume definition and the reading routine are our method, not sourced research.
Drafted with AI assistance, then fact-checked and edited by the Mind Over Ticks team.
Up next · 6 minWhere to put a stop: use structure, not a round number