 Mind
Position Sizing in Plain Numbers: From Account Size to Share Count
Educational only, not financial advice (disclaimer).
Most of us start trading with one question in mind: what should we buy? It feels like the whole game. But there is a quieter question that matters just as much, and it usually gets skipped: how much should we buy?
That second question is position sizing. It decides how much one trade can hurt us when it goes wrong. A great setup with far too much money on it can still end badly. An average setup sized sensibly usually means a small, survivable loss when we are wrong.
In this post we will walk from an account balance to an exact share count, one step at a time, with plain arithmetic. No special software, no secret formula. Just a calculator and a little discipline.
First, a few beginner terms
Before we do any math, let’s agree on the words we will use.
- Account size: the money in the trading account we are sizing from.
- Entry: the price where we plan to buy.
- Stop: the price where we have decided, in advance, that the idea is wrong and we will exit.
- Risk per share: the distance between entry and stop. If we buy at the entry and get stopped out, that is roughly what we lose on each share.
- Risk percent: the slice of the account we are willing to lose if this one trade fails.
The key shift is this: we do not start from “how many shares feel right.” We start from “how much money am I willing to lose on this trade,” and work backward.
The two-line formula
Here is the whole method:
- Risk dollars = account size x risk percent
- Shares = risk dollars / (entry minus stop)
That is it. The first line sets our budget for being wrong. The second line spreads that budget across the distance to our stop.
Notice what is not in the formula: how confident we feel, how exciting the chart looks, or how much we lost yesterday. That is on purpose. The formula is there to take emotion out of the size.
A worked example (hypothetical numbers)
Every number in this example is made up for teaching. It is not a real trade, a real stock or a recommendation.
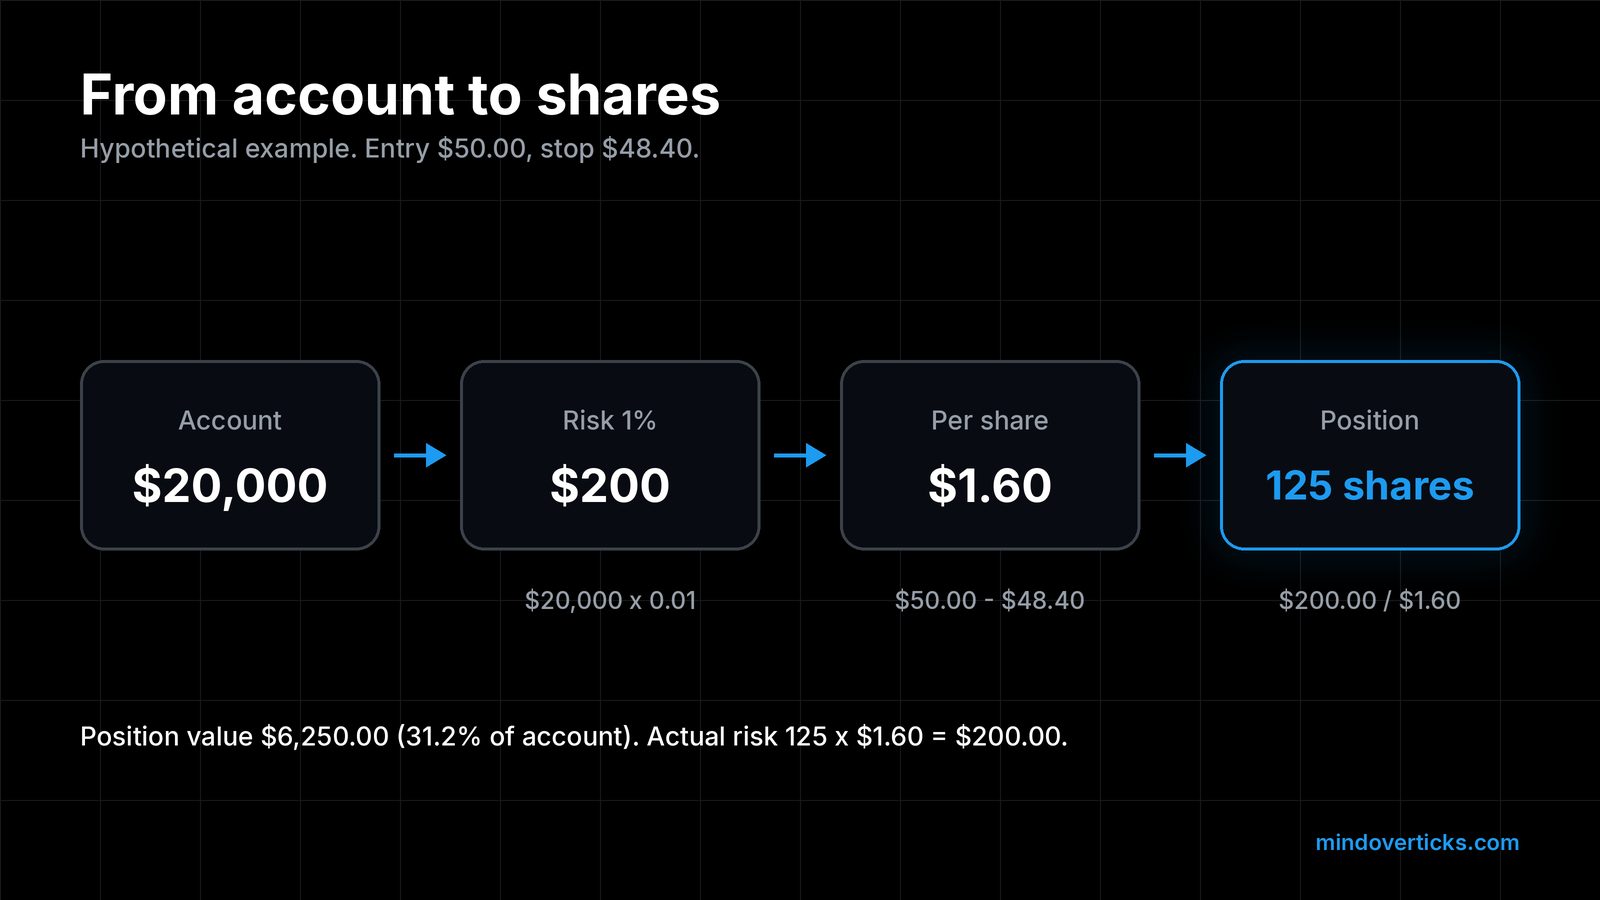
Say we have a hypothetical account of $20,000, and we have decided to risk 1% per trade. We like a stock at $50.00, and the chart tells us the idea is wrong below $48.40, so that is our stop.
Step 1: risk dollars. $20,000 x 1% = $200. That is the most we plan to lose if this trade fails.
Step 2: risk per share. $50.00 minus $48.40 = $1.60 per share.
Step 3: share count. $200 / $1.60 = 125 shares.
Step 4: sanity check. 125 shares x $1.60 = $200 of risk. The position itself is worth 125 x $50.00 = $6,250, about 31% of the account.
That last line surprises a lot of new traders. We are putting about a third of the account into the position, yet we are only risking 1% of it. Those are two different numbers. Position value is how much money is tied up. Risk is how much we lose if the stop is hit. Sizing is about the second one.
Always round down
Real life rarely divides as neatly as our example. Suppose, in a hypothetical case, the math gives us 117.6 shares. We cannot buy six tenths of a share at most brokers, so we round to a whole number. The rule is simple: round down, never up. Rounding down keeps us at or under our risk budget. Rounding up quietly pushes us over it, and those small overages add up across many trades.
Leave room for costs and slippage
Our formula assumes we get filled exactly at the entry and exactly at the stop. Markets do not always cooperate. A standard stop order becomes a market order once triggered, and in a fast move the fill can land below the stop price. That gap is called slippage. Commissions and fees, where our broker charges them, also come out of the result.
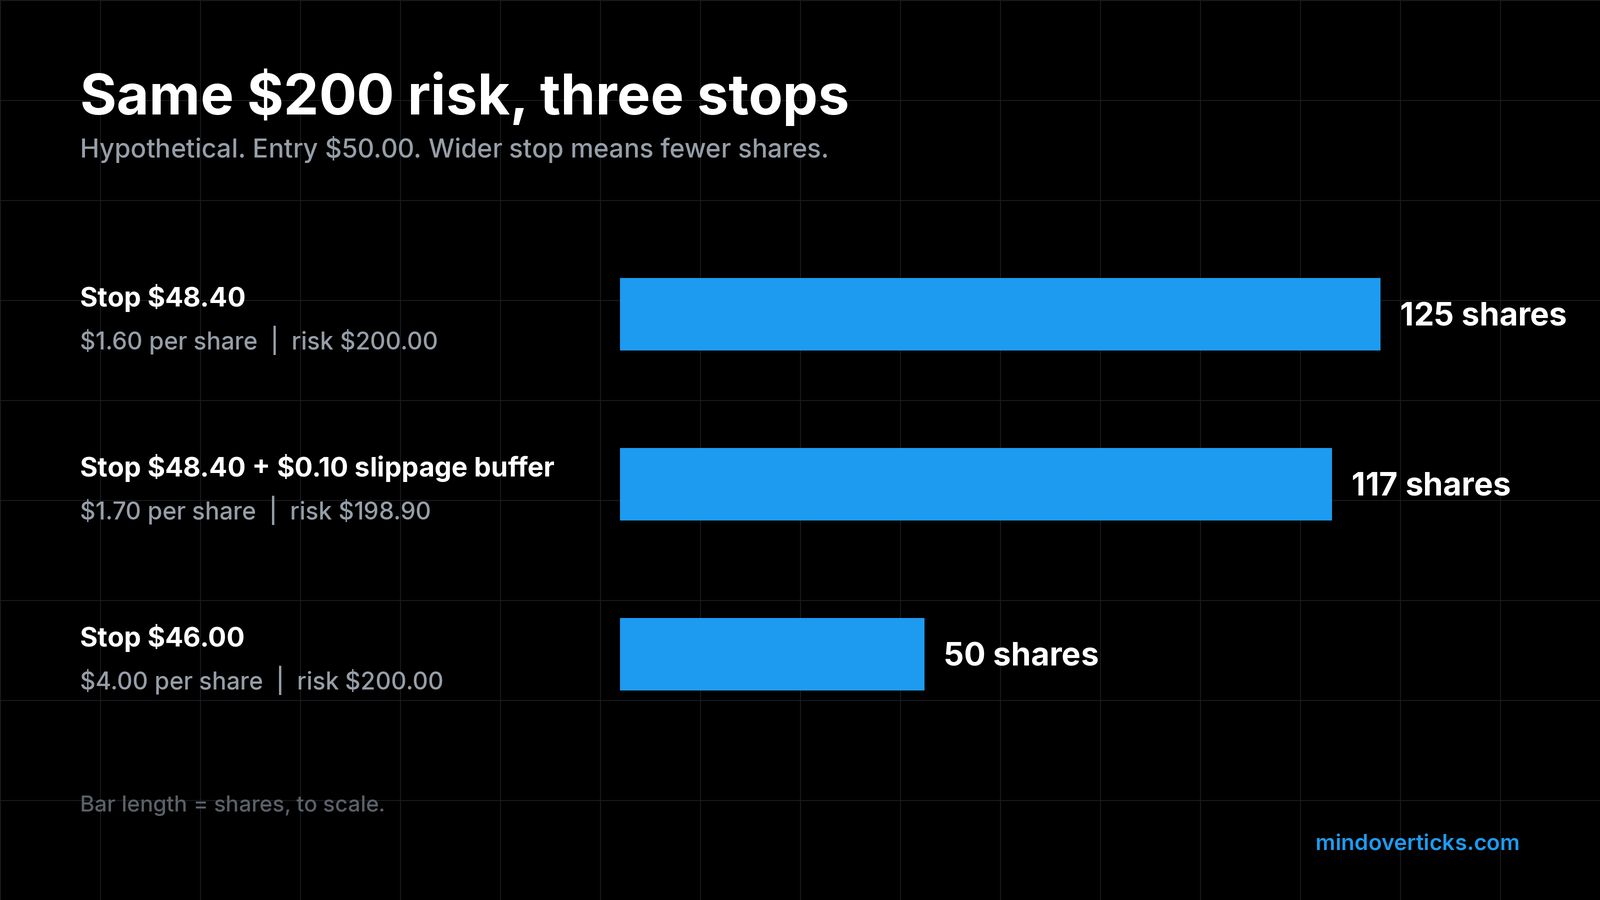
One simple habit is to add a small buffer to the risk per share before dividing. In our hypothetical example, if we assume an extra $0.10 of slippage:
- Risk per share becomes $1.60 + $0.10 = $1.70
- Shares become $200 / $1.70 = 117.6, rounded down to 117
- Planned risk becomes 117 x $1.70 = $198.90
The buffer is our own assumption, not a market statistic. How big it should be depends on the instrument, the time of day and how liquid it is. Thinner, less liquid markets tend to fill less predictably, so a bigger buffer makes sense there. Our upcoming post in this series on market, limit and stop orders covers how each order type gets filled.
Wider stop, smaller size
Here is the part that changes how many traders think. Suppose that, in the same hypothetical setup, the chart honestly says the stop belongs at $46.00 instead of $48.40.
- Risk per share: $50.00 minus $46.00 = $4.00
- Shares: $200 / $4.00 = 50 shares
- Risk: 50 x $4.00 = $200
The dollar risk did not change at all. Only the share count did. A wider stop means fewer shares, and a tighter stop means more shares. That frees us to put the stop where the chart says it belongs, instead of squeezing it closer just to buy more shares. The stop comes from the chart. The size comes from the math.
What about futures?
The same idea works for futures, with one change. Instead of risk per share, we use risk per contract:
Contracts = risk dollars / (stop distance in points x dollar value per point)
Each futures contract has its own dollar value per point (or per tick), set by the exchange that lists it. We always look that figure up on the exchange’s contract specification page for the exact product we trade, rather than trusting memory or a forum post. Then we round down to whole contracts, the same way we round shares. If even one contract would risk more than our budget, the honest answer is that the trade is too big for the account right now, and we pass.
A short pre-trade checklist
Before we place the order, we run through this:
- Is the stop set by the chart, not by the size we want?
- Is risk dollars = account x risk percent, using today’s account balance?
- Did we divide by (entry minus stop), plus any slippage buffer?
- Did we round down?
- Does shares x risk per share land at or under our budget?
Five questions, under a minute. That minute is cheap insurance.
Why this matters more than it looks
Position sizing is the part of trading we fully control. We cannot control whether a trade works. We can control how much a failed trade costs. Our companion piece, the 1% rule, walks through how small risk holds up during a losing streak, with the drawdown math step by step. And our post on where to put a stop covers the other half of this formula.
Takeaway
- Start from the money you are willing to lose, not the shares you want to own.
- Risk dollars = account x risk %. Shares = risk dollars / (entry minus stop).
- Always round down, and leave a buffer for costs and slippage.
- Wider stop, fewer shares. Tighter stop, more shares. The dollar risk stays the same.
- Position value and risk are different numbers. Size by risk.
All figures in this post are hypothetical examples for education only. This is not financial advice.
Drafted with AI assistance, then fact-checked and edited by the Mind Over Ticks team.
Up next · 6 minThe 1% Rule: How Small Risk Keeps You in the Game Through a Losing Streak