 Mind
Kelly Sizing From a Short Backtest: The Drawdown Math
Educational only, not financial advice (disclaimer).
By Mind Over Ticks editorial team
This post contains an affiliate link. We earn a commission if you buy through it.
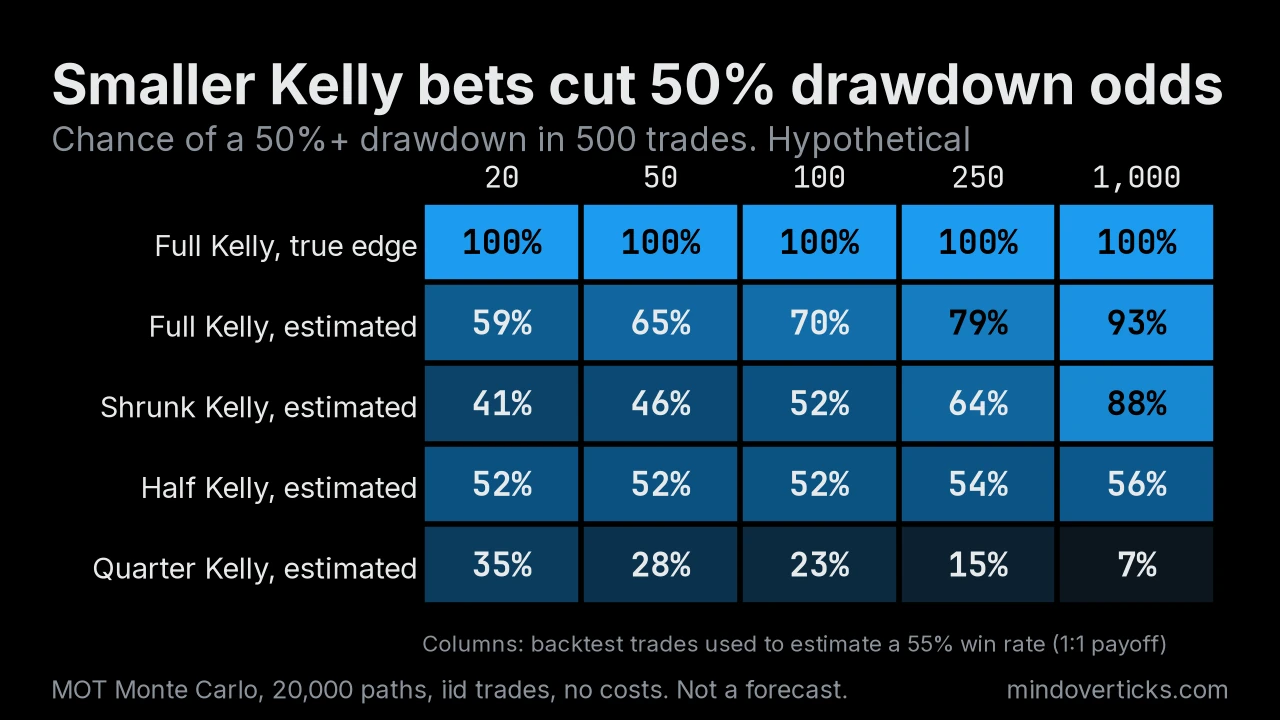
Bet full Kelly on a 100-trade backtest and, in our hypothetical simulation (see the required statement beside the chart), 70% of traders hit a 50% drawdown within the next 500 trades.
The Kelly criterion in trading assumes you know your edge; a short backtest does not. Your backtest says you win 55% of even-money trades, so Kelly says bet 10%. But the true number could be 50% or 60%, and full-Kelly traders using that 100-trade estimate overbet the true Kelly fraction 46% of the time.
The short answer
In our hypothetical simulation (see the required statement beside the chart), with a modest edge and a backtest of 50 to 250 trades, the chance of a 50% drawdown over the next 500 trades was:
| Rule | 50% drawdown odds |
|---|---|
| Full Kelly on the estimate | 65% to 79% |
| Half Kelly | about 52% to 54% |
| Quarter Kelly | 15% to 28% |
Quarter Kelly alone stayed under 30%.
Kelly assumes you know the odds
Kelly’s 1956 paper maximizes long-run growth for a gambler who knows the true probabilities (Kelly 1956). At even money, that is the win probability minus the loss probability.
Baker and McHale (2013) showed that plugging in an estimate makes Kelly do worse out of sample, and that bets should be shrunk (Baker and McHale 2013).
Poluri’s paper
N. Poluri’s 2026 SSRN working paper, not yet peer reviewed, asks how many trades you need before you trust Kelly (Poluri, DOI 10.2139/ssrn.7549165). He simulated 200,000 traders per setup and found the best fraction of Kelly follows S/(S+1), with an evidence score S = N times k squared, and about 0.7/k squared backtested trades before half Kelly is justified. Here k = 2p - 1, the true edge of an even-money bet and also the Kelly bet.
It measures long-term growth only, not drawdowns (his Section 5.5). Every drawdown figure here is from our own simulation, and one rule applies his S/(S+1) shrink with k estimated from the backtest.
How we simulated it
- Each trade wins with probability p and pays +1, or loses 1 (scenario A: p = 55%, true Kelly 10%).
- A trader estimates the win rate from N backtest trades and computes Kelly from it, sitting out if the estimate shows no edge.
- The trader then takes 500 live trades at a fixed fraction of current equity: full, half or quarter of estimated Kelly, or the estimate times S/(S+1).
- 20,000 simulated traders per cell, seed 20261025 (code on file). Max drawdown is the largest peak-to-trough fall.
The lookup table
Scenario A, 500 forward trades. “Overbet”: the bet exceeded true Kelly. “Sit out”: the backtest showed no edge, so no trades.
| Backtest trades | Rule | Mean bet | Overbet | Sit out | Median growth | DD 20%+ | DD 30%+ | DD 50%+ |
|---|---|---|---|---|---|---|---|---|
| 50 | Full | 12.0% | 50% | 28% | 1.0x | 72% | 71% | 65% |
| 50 | Half | 6.0% | 20% | 28% | 2.4x | 70% | 64% | 52% |
| 50 | Quarter | 3.0% | 1% | 28% | 2.0x | 60% | 49% | 28% |
| 50 | S/(S+1) | 7.7% | 29% | 28% | 1.1x | 59% | 53% | 46% |
| 100 | Full | 10.8% | 46% | 18% | 2.2x | 80% | 77% | 70% |
| 100 | Half | 5.4% | 13% | 18% | 3.2x | 75% | 68% | 52% |
| 100 | Quarter | 2.7% | 0% | 18% | 2.3x | 63% | 49% | 23% |
| 100 | S/(S+1) | 7.4% | 31% | 18% | 1.6x | 66% | 61% | 52% |
| 250 | Full | 10.2% | 50% | 6% | 4.9x | 91% | 88% | 79% |
| 250 | Half | 5.1% | 5% | 6% | 4.2x | 85% | 77% | 54% |
| 250 | Quarter | 2.6% | 0% | 6% | 2.5x | 70% | 49% | 15% |
| 250 | S/(S+1) | 7.8% | 36% | 6% | 3.4x | 80% | 76% | 64% |
| Known edge | Full true Kelly | 10% | n/a | 0% | 12.2x | 100% | 100% | 99.9% |
Monte Carlo error on each probability is at most about 0.7 percentage points (sampling noise only, not model error). Rows for 20 and 1,000 trades are in the results file.
What the table says about fractional Kelly
Full Kelly with a known edge still crashes. The trader who knew the true win rate saw a 50% drawdown in 99.9% of runs, while growing a median 12.2x.
Estimation error makes overbetting a coin flip. About half of full-Kelly traders overbet at every sample size. At 50 to 100 trades, the median full-Kelly trader ended between 1.0x and 2.2x.
Half Kelly cuts deep drawdowns but does not make them rare.
Quarter Kelly bought the most protection, at the cost of median growth on large backtests.
S/(S+1) targets growth, not drawdowns. For an edge this size, S reaches 1 only near 100 trades; as N grows the rule heads toward full-Kelly drawdowns.
Small samples look safer than they are. With 50 backtest trades, 28% of traders sat out, which pulls that row’s drawdown odds down.
Worked example
With 100 backtest trades at 55%, quarter Kelly gave up about a quarter of half Kelly’s median growth (2.3x vs 3.2x) and cut the 50% drawdown odds by more than half (23% vs 52%). Full Kelly on the estimate: 70% and 2.2x.
Limits
- Trades are independent, binary and fixed-payoff, with the payoff treated as known. Real R-multiples vary.
- No commissions, spread, slippage, financing, gaps beyond the stop, serial correlation or regime change. Each would raise drawdowns.
- One edge size (per-trade Sharpe about 0.10). A second scenario (p = 45%, pays 1.5 to 1, true Kelly 8.33%) gave full, half and quarter Kelly figures within about 1.5 percentage points; its S/(S+1) rows differ by up to 6 points. Applying S/(S+1) there is our extension, not Poluri’s setup.
Further reading
William Poundstone’s Fortune’s Formula is a popular history of the Kelly criterion. See it on Amazon (affiliate link). As an Amazon Associate we earn from qualifying purchases.
Related: Volume vs liquidity.
How this was made: researched and drafted with AI tools from cited sources, then fact-checked and edited under our editorial standards. See our Editorial Process page.
Mind Over Ticks publishes general education, not personalized investment advice. We do not know your situation. Talk to a licensed professional before acting. Nothing here is a trading rule or a recommendation.