Mind
Fair Price and Auction Theory, Simplified
Price isn't going somewhere. It's looking for someone. Once that clicks, chasing stops feeling so urgent.
Contains affiliate links; we may earn a commission at no cost to you (details). Educational only, not financial advice (disclaimer).
Used car lot. Sticker says $30,000. You laugh. At $27,000 you shrug. At $24,000 you and three other guys reach for your wallets.
That’s fair price. Markets find it the same way, just faster. (Want the deeper version? Auction Market Theory Explained.)
Price is looking for the other side
Price moves to find someone to trade with.
Buyers want in and nobody’s selling? Price ticks up until a seller says “fine.” Sellers dumping and no bids? Price drops until someone sees a bargain.
A big candle isn’t strength by itself. It’s the market sprinting through prices where nobody wanted to trade, hunting for a level where business picks up.
Fair price is where the business happens
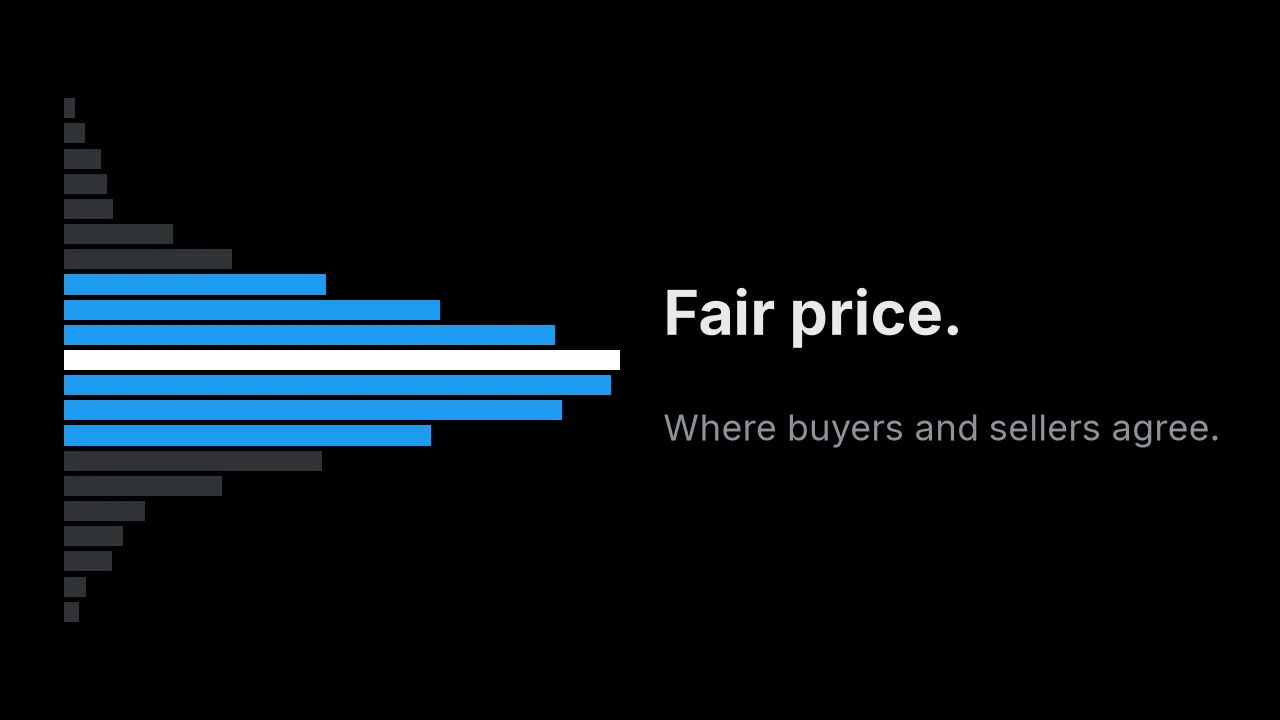
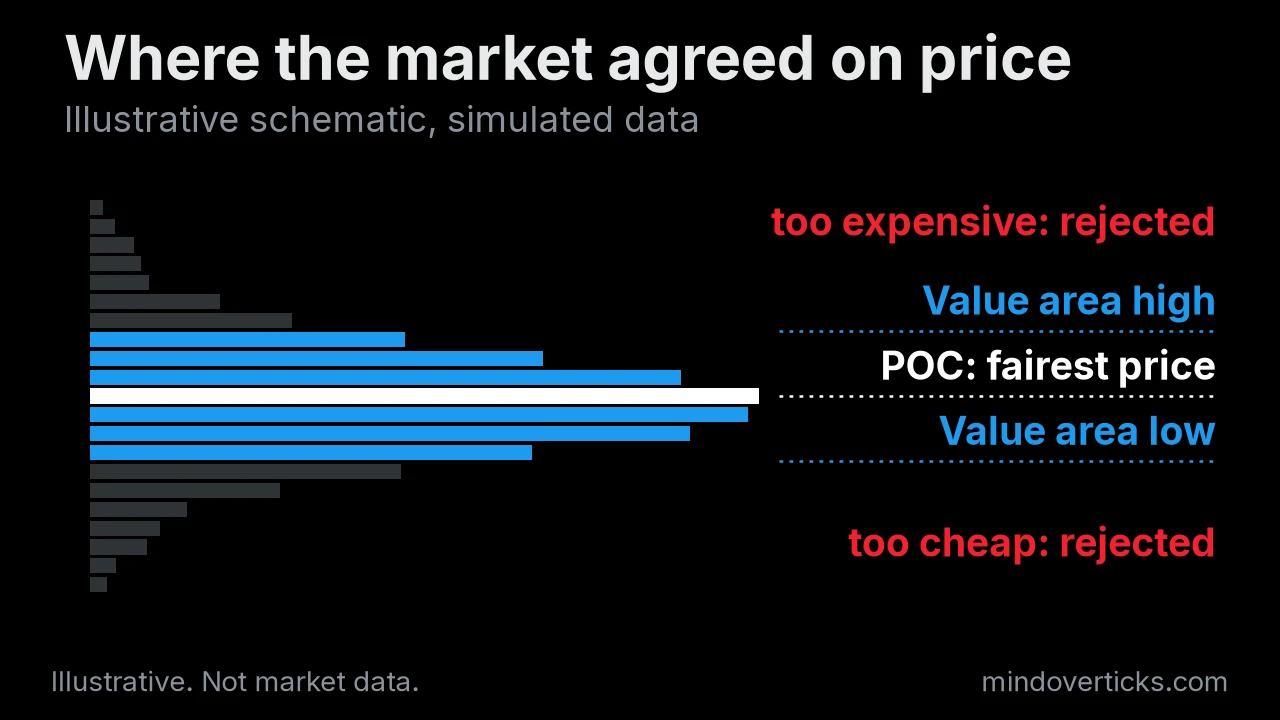
Each session settles into a zone both sides can live with. That’s fair value. A volume profile shows it: the chart turned sideways, volume stacked at each price.
| Label | What it means |
|---|---|
| POC | Price with the most volume. The market’s favorite price that session. |
| Value area | Range holding about 70% of volume. Top = VAH, bottom = VAL. |
| Tails | Thin spots. Price visited, nobody traded, price left. |
Thin tails matter as much as the fat middle. They’re the market saying “too expensive up here” or “too cheap down here.”
Balance and imbalance
Balance: price rotates inside a range. Pokes the top, rejected. Drifts to the bottom, rejected. Back to the middle.
Imbalance: news, a big player, a mood shift. One side gets aggressive and price leaves to find new business. That’s a trend leg.
Then it finds a new zone both sides like, and a new balance forms.
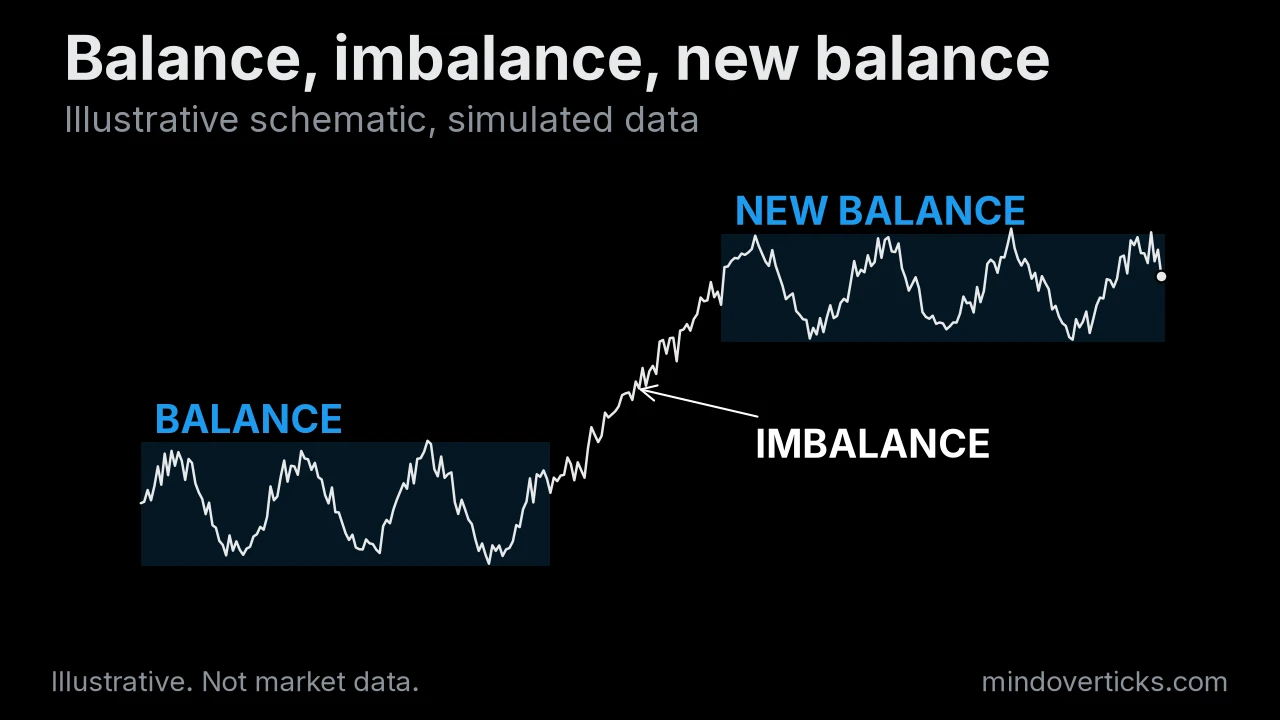
In balance, buying the top of the range is a bad bet. In imbalance, fading the move is the bad bet. Know which one you’re in.
Acceptance vs rejection
Price just broke out of value. Real or fake?
| Acceptance | Rejection |
|---|---|
| Stays outside value | Snaps back inside fast |
| Pullback holds the old VAH/VAL | Long wicks, thin volume |
| New volume builds up there | Back near the old POC soon |
| Several bars, not one wick | One poke and done |
A common rule: if price breaks out, comes back inside value and holds there, it often rotates to the other side of the value area. The market went back to the price it trusted.
You don’t have to predict which one. You just have to wait long enough to see it.
Why chasing feels urgent but isn’t
When price rips away from value, everything in your body says now. That’s FOMO, and it’s loudest exactly where the trade is worst: in the thin part, where the crowd hasn’t agreed yet.
Two outcomes:
- Rejected. Price returns to value. If you chased, you bought the exact price the market just called too expensive.
- Accepted. Value builds up there. That takes time, so you get pullbacks and a calmer entry with a clearer stop.
Either way, waiting cost you little. The market moves to find trade, and once it finds it, it hangs around.
Tomorrow’s checklist
- Mark yesterday’s value area and POC.
- Note the open: inside value means expect rotation. Outside means watch for acceptance or rejection.
- Skip the first poke outside value. See what happens next.
- In balance, sell near VAH and buy near VAL, stops beyond the edge.
- Log every urge to chase in your journal. Check later where price actually went.
Add the clock with price and time, and check market structure for which way the bigger auction leans.
Educational content, not financial advice. See our disclaimer.
What is fair price in trading?
Fair price is the area where buyers and sellers are both happy to trade a lot. On a volume profile it shows up as the fattest part of the distribution, centered on the point of control.
What is the difference between acceptance and rejection?
Acceptance means price moves to a new level and trade builds there over time. Rejection means price pokes into a level, finds almost no business, and quickly leaves.
Should I chase price that's far from value?
Usually not. Price far from value is a test. Either it gets accepted and you'll often get a calmer entry later, or it gets rejected and you avoided buying the extreme.