 Mind
What a Candlestick Actually Tells You
Educational only, not financial advice (disclaimer).
Open almost any trading chart and we see the same thing: rows of little red and green boxes with thin lines poking out of them. They look busy, maybe a bit intimidating.
The good news: each of those boxes, called a candlestick, is just four prices drawn as a picture. Once we know which part is which, every bar tells a small story. No secret code, no fancy indicators.
Let’s read one together.
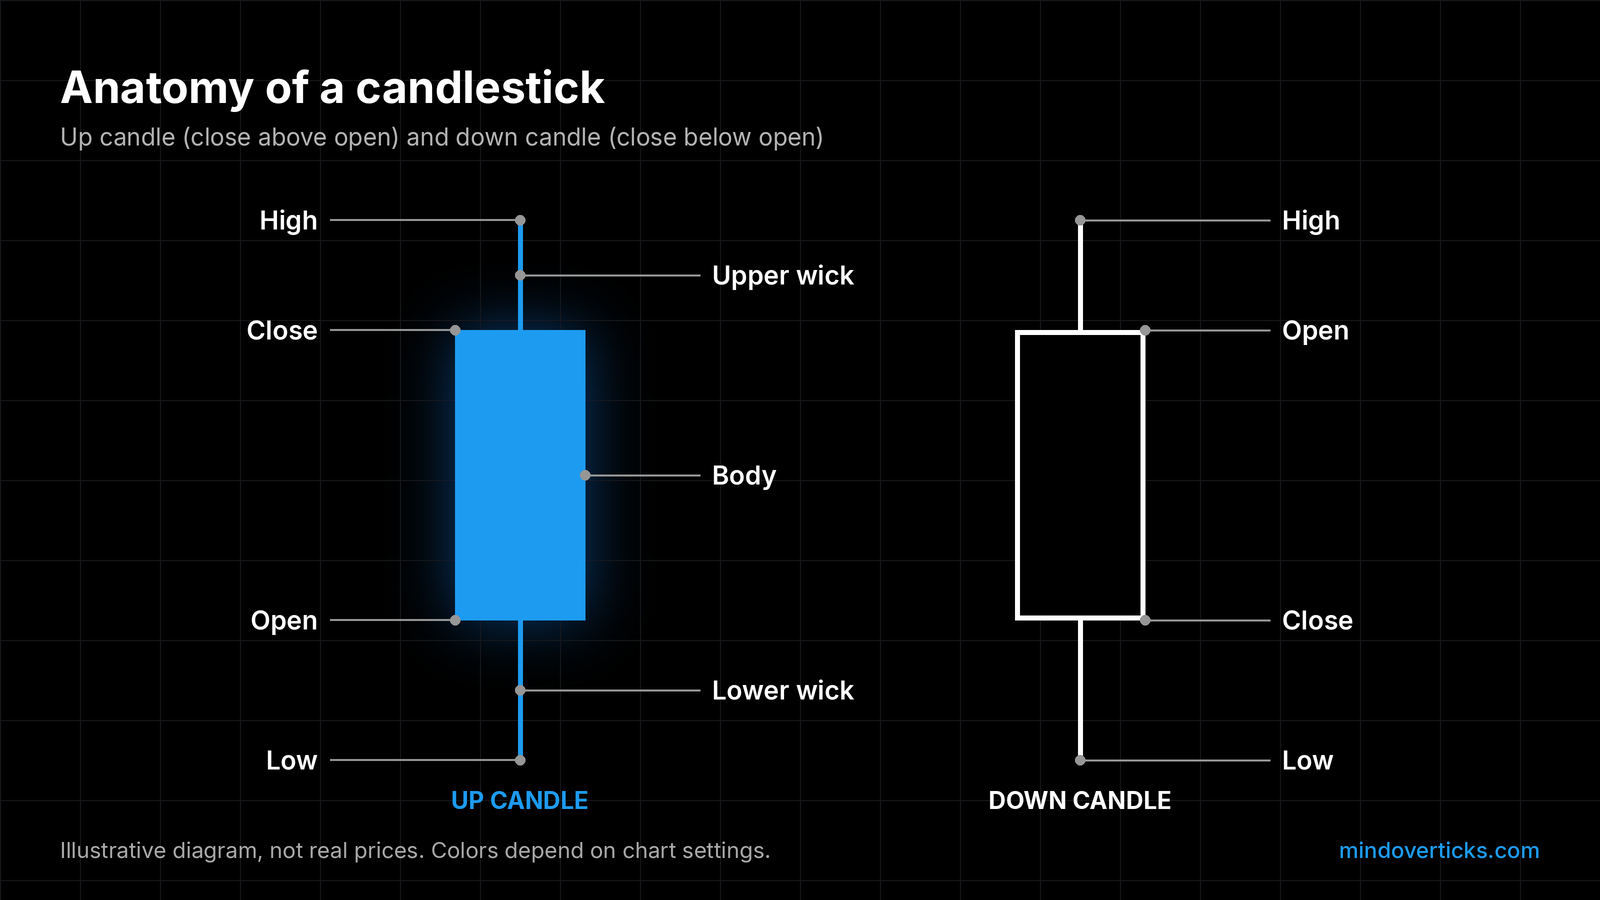
Illustrative diagram, not real prices. Colors depend on chart settings.
The four prices in every candle
On a time-based chart, every candlestick covers one stretch of time: a minute, a day, a week. CME Group’s chart course puts it this way: a new bar appears after “a set amount of time has passed,” which “can be anywhere from one minute to a week or year” (CME Group).
Inside that stretch of time, the candle records four prices:
- Open: the first price of the period.
- High: the highest price traded.
- Low: the lowest price traded.
- Close: the last price of the period.
That’s it. A bar chart, sometimes called an OHLC chart, shows the very same four prices; CME notes that “Like a candlestick chart, a bar chart provides four pieces of data for each time period: the open, high, low and close” (CME Group). The candle just draws them in a way our eyes read faster.
The body: where we started and where we ended
The thick part of the candle is the body. In CME’s words, “The body of the candle, the thicker middle portion, shows the open and closing prices during the time frame” (CME Group).
The color tells us which way it went. “If the open is lower than the close, then the color of the bar will generally be green, depending on the color settings of your software. If the closing price is lower than the opening price, then the bar will generally be red” (CME Group).
So a green body means price finished higher than it started. A red body means it finished lower. Worth saying out loud: green does not mean “good” and red does not mean “bad.” It’s just direction. In our own diagrams, up candles are blue and down candles are white.
Body size matters too. CME says “the size of the body indicates the intensity of buying or selling. The longer the body, the more price moved over the time period of that candlestick” (CME Group). A tiny body means open and close were close together, which CME reads as “not much strength to price action.”
The wicks: where price went exploring
The thin lines above and below the body are the wicks (some charts call them shadows). CME: “The wick, illustrated by a thin line at the top and bottom of the body, shows the highest and lowest prices traded over the time frame” (CME Group).
We like to think of wicks as the places price visited but didn’t stay. The top of the upper wick is the high. The bottom of the lower wick is the low.
Short wicks and long wicks tell different stories:
- Short or no wicks: per CME, “price action was strong in to the close” and one side “were in control for the entire time period.”
- Long wicks: “there was a large range of prices traded and buyers and sellers were both in control” (CME Group).
Putting it together: the story of one bar
Now the fun part: reading a single candle like a short story.
Hypothetical example (made-up prices, not a real stock): a daily candle opens at $50, climbs as high as $54, dips as low as $49, and closes at $50.50.
Let’s narrate it:
- The open, $50: the day starts here.
- The high, $54: buyers pushed price up $4 at some point. That top is the tip of the upper wick.
- The low, $49: at some point sellers pushed it $1 under the open. That’s the tip of the lower wick.
- The close, $50.50: the day ends just 50 cents above where it began, so the body is small and green.
So what happened? Buyers had a big moment but couldn’t hold it, and handed most of the run up back before the close. The long upper wick is the footprint of that rally that faded.
CME describes this kind of shape directly: “If you have a small body near the low of bar, it means that at the end of the bar sellers had taken control from the buyers who were strong at the open of the bar” (CME Group). Our hypothetical bar has its small body near the low of its range, with a tall wick above. Same idea.
And the mirror image: “If you have a small body near the top of the bar, it means that buyers took control from sellers at the end of the time period.”
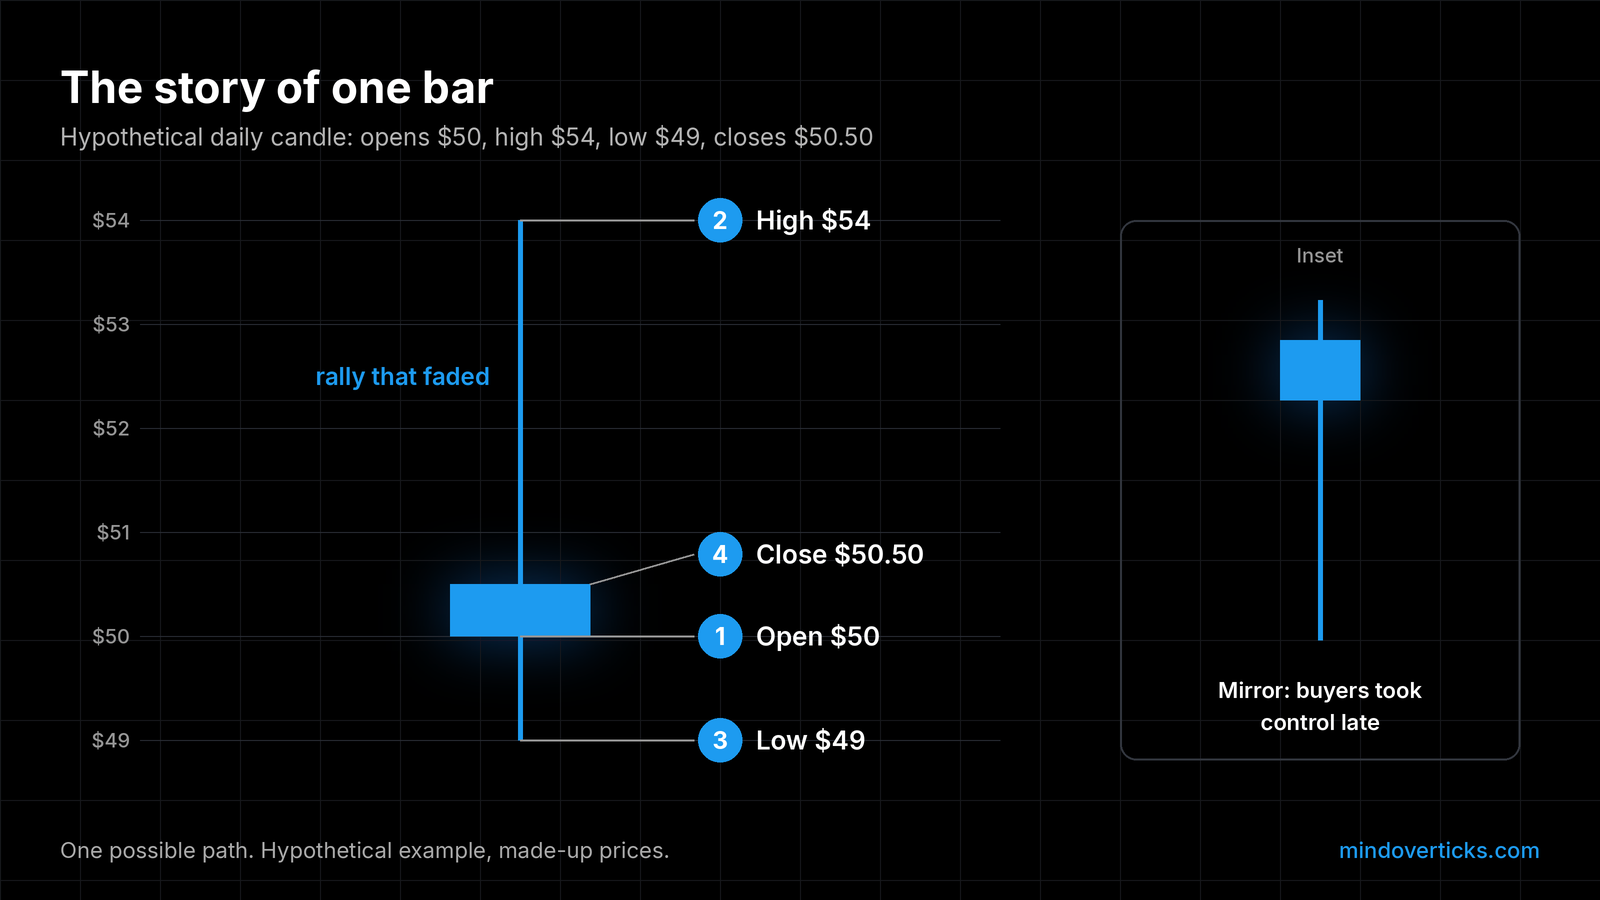
One possible path. Hypothetical example, made-up prices.
What one candle can’t tell us
We love a good story, but one bar is only one chapter. A few honest limits:
- It doesn’t show the order of events. Our hypothetical candle doesn’t tell us whether the $54 high came before or after the $49 low. A smaller time frame would.
- It depends on the time frame. CME notes a longer-term trader “may track price on a weekly or monthly chart while a shorter-term trader may use charts with a 60-minute or 5-minute chart” (CME Group). The same hour can look calm on a daily candle and wild on a 1-minute chart.
- It doesn’t show how much traded. Candles show price, not volume.
- The clock matters. A daily candle’s open and close depend on which session we’re looking at.
- It’s a clue, not a signal. In our view, one candle is a clue to read alongside everything else on the chart, not a signal to act on by itself.
A quick practice habit
Here’s a small habit we find genuinely fun. Pick any chart, any time frame. Choose one candle and say its story in one sentence: where it opened, where it went exploring, and who seemed to be in charge at the close.
Do five candles a day. Nobody needs to get it “right.” The point is that we start seeing the chart as a sequence of little stories instead of a wall of boxes. And noticing that we read a bar a little faster than last week? That’s real progress. When we’re ready to act on what we see, our guide to market, limit and stop orders covers which order fits.
So here’s our question for you: what’s a candle that taught you something, a long wick or a huge body that made you stop and look twice? Tell us about it in the replies.
Mind Over Ticks publishes general education, not personalized investment advice. We do not know your situation. Talk to a licensed professional before acting. Nothing here is a trading rule or a recommendation.
Drafted with AI assistance, then fact-checked and edited by the Mind Over Ticks team.
Up next · 6 minHow to keep a trading journal you'll actually use